Are you curious about how well your favorite Amazon products are selling? Curious about who is winning the sales race between two products?
Keen to see if a sale is really as good as it seems? If so, you need to start using. Keepa is a free online tool that allows you to read graphs of product sales on Amazon.
It’s simple to use and very user-friendly. In this blog post, I’ll explain how to use Keepa and show you some examples of what the graphs look like. Stay tuned!
How To Use Keepa And Read Keepa Graphs
What Is Keepa?
Keepa is an online tool that allows users to track the price history of any product on Amazon, making it easy to find the best deals and get incredible discounts.
Whether you’re looking to buy a new piece of tech, a fashion item, or anything else, Keepa can help you find the best possible deal. With just a few clicks, you can view historical pricing data for millions of products across all different categories.
And with its intuitive interface and powerful search functions, Keepa makes it easy for anyone to find exactly what they need at the lowest price possible.
So if you’re looking to save money on your next big purchase, check out Keepa and start tracking prices to get the best deals!
How to Read Keepa Graphs?
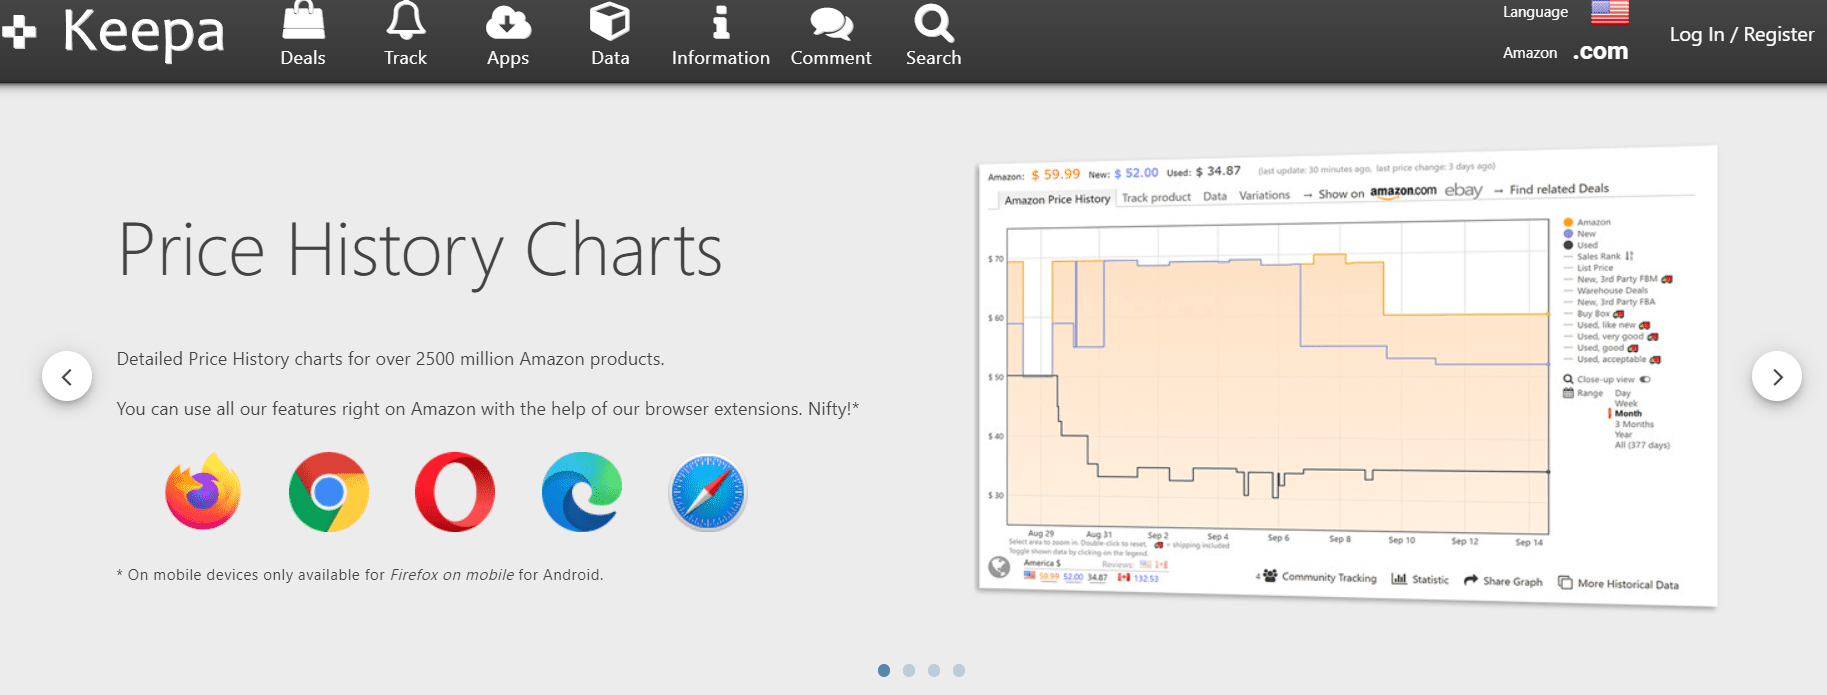
Reading Keepa graphs is a useful way to gain insight into current pricing trends for specific products on Amazon.
The main advantage of reading these graphs is that they allow you to quickly and easily identify the best time to buy a particular product based on how its price has fluctuated over a given period of time.
To read a graph, you simply need to find the time period that interests you from the dropdown menu at the top of the page and view the corresponding data to get a clear overview of how prices have changed in that time frame.
Some key metrics that are typically analyzed in Keepa graphs include peak price, lowest price, highest ranking, inventory tracking, and daily revenue tracking. Additionally, it’s possible to conduct more advanced analyses based on additional variables like region and category.
By understanding how to read the graph effectively, you can maximize your purchasing power and get great deals on the products you want most.
What does the Keepa Graph show?
The Keepa graph is a powerful tool for analyzing the data behind online sales. It can provide valuable insights into which products are selling well, which prices work best, and how shoppers behave over time.
By looking at key metrics like conversion rates and uplift percentages, it is possible to spot trends and stay ahead of the competition. And thanks to its unique algorithm, the Keepa graph is able to show accurate data across millions of different products and thousands of different sellers.
Overall, the graph is an incredibly useful tool for anyone who wants to succeed in today’s cutthroat eCommerce landscape.
Whether you’re a seller looking to optimize your product listings or simply a shopper trying to find the best bargains, it has something for everyone. So why not give it a try? You won’t be disappointed!
Is it easy to use Keepa?
Keepa is a Chrome and Firefox extension that allows users to track prices on Amazon and make informed purchasing decisions. The extension is free to use, and it can be installed in just a few clicks.
Once it is installed, users can simply hover over any Amazon product and view its price history. This information can be incredibly useful when trying to determine whether or not a product is currently being offered at a good price.
In addition, it also allows users to set up price drop alerts, so they will be notified as soon as a product they are interested in goes on sale. Overall, it is a valuable tool for anyone who regularly shops on Amazon, and it is very easy to use.
Conclusion- How To Use Keepa And Read Keepa Graphs- Best Guide 2026
In conclusion, Keepa graphs are a powerful tool for understanding how your product is selling on Amazon. They can help you to identify trends and make decisions about pricing, inventory, and more.
By reading the graphs correctly, you can gain valuable insights into what customers want and how they interact with your product listing. We hope that this article has helped you to understand how to use graphs and provided some tips on how to improve your Amazon sales.
Quick Links

