Forecasting is an essential part of supply chain management. By predicting future trends and possible disasters, businesses can better prepare themselves for disruptions to their supply chains.
There are many different methods for forecasting, each with its own strengths and weaknesses. In this blog post, we’ll explore some of the most common forecasting methods and discuss how they can help your business stay ahead of the curve. Stay safe and stay prosperous!
What is supply chain forecasting?

Forecasting is a process of estimating future events. In the business world, forecasting is used to predict demand for products and services. This information is used to ensure that there is an adequate supply of goods and services to meet customer demand.
There are a number of different forecasting methods that can be used to predict demand. The most common method is trend analysis. This approach looks at past sales data to identify patterns and trends. Other methods include regression analysis, survey data, and market analysis.
Forecasting is an important part of supply chain management. By predicting demand, businesses can ensure that they have enough inventory on hand to meet customer needs. This can help to avoid stockouts and lost sales. Forecasting can also help businesses plan their production schedules, ensuring that they have the resources necessary to meet demand.
Forecasting is an essential tool for businesses of all sizes. By using forecasting methods correctly, businesses can ensure that they have the right products in stock and are able to meet customer demand.
Why is supply chain forecasting important?
The Importance of Supply Chain Forecasting
In order for a retailer to be successful, it is important that they have a good understanding of what is happening in their supply chain. This includes being able to forecast future demand for their products.
If a retailer underestimates demand, they may not be able to meet customer needs, which can lead to lost sales and customer dissatisfaction. Conversely, if a retailer overestimates demand, they may end up with too much stock, which can lead to increased costs and reduced profits.
Forecasting is essential for retailers because it allows them to plan for future needs. By having accurate forecasts in place, retailers can ensure that they have the right amount of stock on hand, as well as the necessary resources in place to meet anticipated demands. Forecasting also helps retailers to optimize inventory levels and pricing strategies, which can lead to increased profits.
It is important for retailers to have a good forecasting process in place so that they can make sound business decisions based on accurate data. Without accurate forecasting, retailers are at risk of losing customers and profits.
5 forecasting methods used in supply chains
1. Moving average forecasting
Forecasting is a critical part of supply chain management. It helps managers prepare for potential disruptions and plan for future needs. There are a variety of different forecasting methods, each with its own strengths and weaknesses. In this article, we’ll focus on moving average forecasting.
Moving average forecasting is based on the idea that past data can be used to predict future trends. Specifically, it uses an average of past data points to forecast future demand. This can be helpful in smoothing out erratic demand patterns and predicting short-term trends.
There are a few things to keep in mind when using moving average forecasting:
- Make sure you have enough data points to generate a reliable average.
- Be aware of seasonality and trend changes that may not be captured in the data.
- Allow for some margin of error, as no forecasting method is perfect.
2. Exponential smoothing
The second forecasting method is exponential smoothing, which is used to predict future values based on past values and trends. There are three types of exponential smoothing: simple, weighted, and double. Each type uses different weights for past values in order to create a more accurate prediction.
Simple exponential smoothing is the most basic type and is used to smooth out peaks and valleys in data sets. It takes the current value and adds a certain percentage of the previous value to it in order to calculate the next value. This percentage is called the smoothing constant, and it determines how much weight is given to past values.
Weighted exponential smoothing gives more weight to recent values than older values, while double exponential smoothing gives the most weight to the most recent value. This helps to prevent recent events from having too much of an impact on predictions and allows for a more accurate forecast.
3. Auto-regressive integrated moving average (ARIMA)
Auto-regressive integrated moving average (ARIMA) is a forecasting method that uses historical data to predict future trends. This method is particularly useful for predicting trends in time series data, which is data that changes over time. ARIMA uses a combination of auto-regressive (AR) and moving average (MA) models to predict future values.
The AR model uses historical data to predict the next value in the series. The MA model uses past values to predict the current value. The ARIMA model combines both of these models to produce a forecast for the next value in the series.
There are three main components of the ARIMA model:
- The p-value, which indicates how many previous values are used in the AR model
- The q-value, which indicates how many previous values are used in the MA model
- The order of the AR and MA models
The p-value and q-value can be determined using the arima() function in R. The order of the AR and MA models can be determined by examining the autocorrelation and partial autocorrelation functions (ACF and PACF) of the data.
The ACF and PACF plots can be created with the acf() and pacf() functions, respectively. The ACF plot will show how correlated successive values are, while the PACF plot will show how correlated different lags of the data are. If there is a correlation at a certain lag, it means that that particular value is helpful in predicting future values.
The order of the AR and MA models can be determined by finding the point where the ACF or PACF curves cross zero. This point is called the “kurtosis” point, and it indicates the order of the ARIMA model.
4. Multiple aggregation prediction algorithm (MAPA)
Multiple aggregation prediction algorithm (MAPA) is a data mining algorithm used to predict future trends. It is similar to the k-means clustering algorithm, but it takes into account the relationships between data points. This allows it to identify patterns that the k-means algorithm might miss.
The MAPA algorithm starts by dividing the data set into k clusters. It then assigns each data point to the cluster with the closest mean. The mean is calculated using all of the data points in the cluster, not just the ones that were used to create the cluster.
The next step is to calculate the centroid for each cluster. The centroid is a point that represents the average location of all of the points in a cluster. The algorithm then recalculates the mean for each cluster based on only the data points in that cluster.
The final step is to compare the new means with the old ones. If the new means are closer to the old ones, then the clusters are considered to be stable. If they are not closer, then the clusters are considered to be unstable and need to be re-clustered.
The MAPA algorithm is a good choice for forecasting future trends because it can identify patterns that other algorithms might miss. It is also able to adapt as new data points are added to the set.
5. Bottom-up forecasting
Forecasting is an essential part of supply chain management. It allows managers to plan for future needs, ensuring that they have the necessary resources to keep their businesses running smoothly.
While there are a number of different forecasting methods, each has its own strengths and weaknesses. In this article, we will discuss bottom-up forecasting, one of the most commonly used methods.
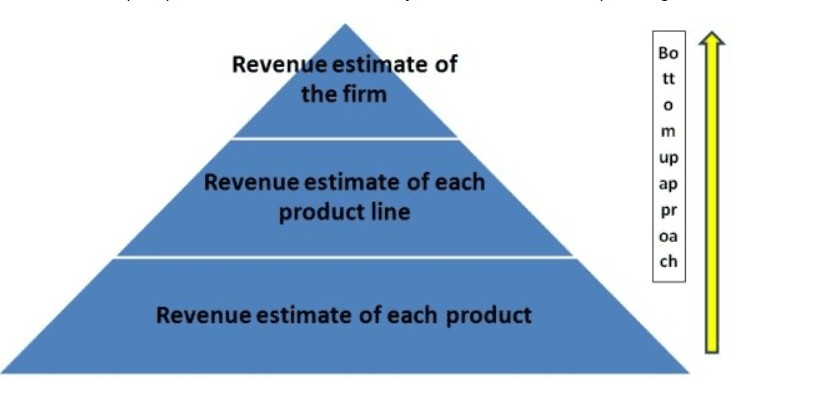
Bottom-up forecasting begins with data collected at the individual unit level and uses this information to build up to more aggregate levels. This approach is often used when demand patterns are difficult to predict or when there is a lot of uncertainty in the market. It can also be helpful when dealing with seasonally-based demand fluctuations.
There are a number of advantages to using bottom-up forecasting. First, it is very granular, which means that it can provide a high level of detail about actual demand.
This makes it well-suited for situations where demand is difficult to predict or when there is a lot of uncertainty in the market. Additionally, because it starts with individual data points, it can be more accurate than other methods in predicting short-term changes in demand.
However, bottom-up forecasting does have some limitations. It can be time consuming and resource intensive, particularly if there is a large volume of data to be analyzed. Additionally, it may not be as effective in predicting long-term trends.
Overall, bottom-up forecasting is a useful tool for supply chain managers who need detailed information about actual demand levels. It can provide insights that other methods cannot and is well-suited for unpredictable or volatile markets.
What is the best method of supply chain forecasting?
It is important for companies to have accurate forecasts of what they will need to produce and sell in order to keep their supply chains running smoothly. However, there is no one perfect method of forecasting. Some methods are more accurate than others, and some are more applicable to certain types of businesses or industries.
The most common method of forecasting is trend analysis. This method looks at historical data to try to identify patterns that will help predict future trends. It can be used for both short-term and long-term forecasting. Another common method is extrapolation. This method uses historical data to estimate how much demand will increase or decrease in the future.
It is often used for short-term forecasting. Mathematical models that use regression analysis are also commonly used for forecasting. These models use historical data to identify relationships between different factors and then use that information to predict future trends.
Another factor that affects which method a company should use is the type of product they sell. For example, a company that sells perishable goods would need to use a different method than a company that sells non-perishable goods.
The perishability of the goods can affect the accuracy of the forecast, since it is difficult to predict how much demand there will be for something that may not last long on the shelves.
Another thing companies need to take into account when forecasting is seasonality. For example, demand for many products tends to be higher during the holiday season than at other times of the year. Companies need to plan for this seasonal demand by stocking up on inventory during the offseason.
There is no one best method of supply chain forecasting. Companies need to carefully consider their own business needs and the type of products they sell before choosing a method that will work best for them
What makes supply chain forecasting difficult?
There are numerous factors that make supply chain forecasting difficult. One of the most important is the fact that demand is never constant. It can change for a variety of reasons, such as economic conditions, changes in customer preferences, or even natural disasters.
In addition, predicting future demand is made more difficult by the fact that many companies do not have a good understanding of their historical demand patterns. This makes it difficult to develop accurate forecasts.
Another challenge with forecasting is that it often requires making assumptions about the future. These assumptions can be based on trends that are observed in the data, but there is always some risk that these trends will not continue into the future. As a result, forecasts can sometimes be inaccurate.
Finally, supply chains are often complex and interconnected, which makes it difficult to predict how changes in one part of the supply chain will impact other parts.
For example, if demand for a product increases, it can be difficult to predict how this will impact suppliers or transportation networks. This can lead to disruptions in the supply chain and lost sales.
So what can companies do to improve their supply chain forecasting? One key is to collect as much data as possible and use analytics to develop accurate models of historical demand patterns.
Companies should also make sure they have a good understanding of their business and what might impact demand for their products. And finally, they should test different forecasting models to see which ones produce the most accurate results.
Quick Links
- How the Amazon Supply Chain Works? Step By Step Guide
- Enterprise Resource Planning (ERP)- Everything You Must Know
- Amazon Inventory Forecasting; Demand Planning- Guide
Conclusion- Supply Chain Forecasting Methods: Preventing & Predicting 2024
Though it isn’t an exact science, supply chain forecasting is essential for businesses that want to remain agile and responsive in the ever-changing marketplace.
By understanding the different methods available and choosing the one that best suits their needs, businesses can avoid weathering storms and instead be proactive in predicting and shaping future trends.


