

The world of smartphones is constantly evolving, and at its heart lies a fascinating rivalry between Apple’s iPhone and the vast array of Android devices.
In 2025, understanding the dynamics of iPhone users & sales statistics is crucial for businesses, developers, and even individual consumers looking to make informed decisions.
iPhones have truly transformed beyond simple communication tools; they are now indispensable instruments for productivity, entertainment, and personal connection, deeply influencing the daily lives of billions.
This comprehensive article dives deep into the latest data on iPhone users, sales, market share, and demographic trends.
We explore how these numbers impact the mobile industry and, more importantly, how you can leverage these insights for your benefit.
We also pull in fresh perspectives from online communities like Quora and Reddit, giving you a truly up-to-date picture of what iPhone users are discussing and demanding.
iPhone Users Statistics: Global Overview
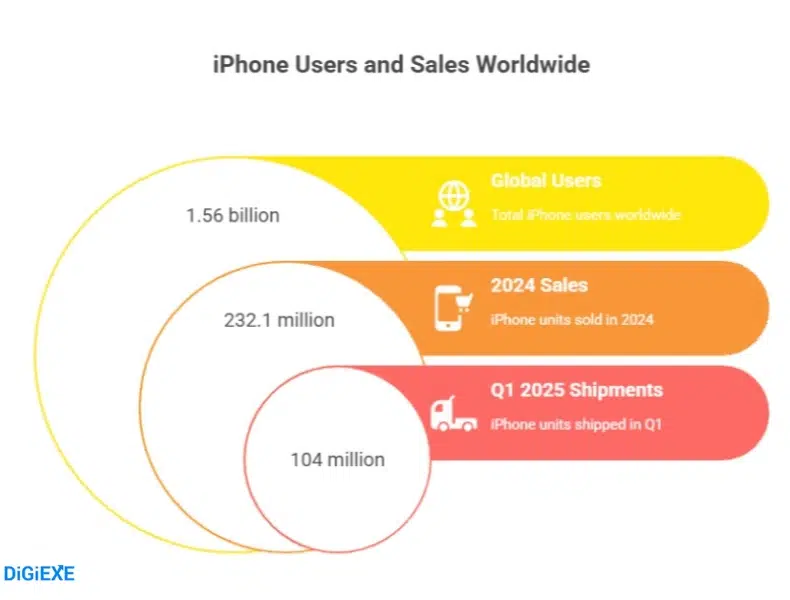
Apple has cultivated a fiercely loyal user base, leading to impressive global adoption. As of 2025, there are over 1.56 billion active iPhone users worldwide.
This represents a staggering increase of over 1.05 billion users in just a decade, showcasing the iPhone’s consistent growth and enduring appeal.
While specific 2025 data is still emerging, the trajectory clearly points to continued expansion.
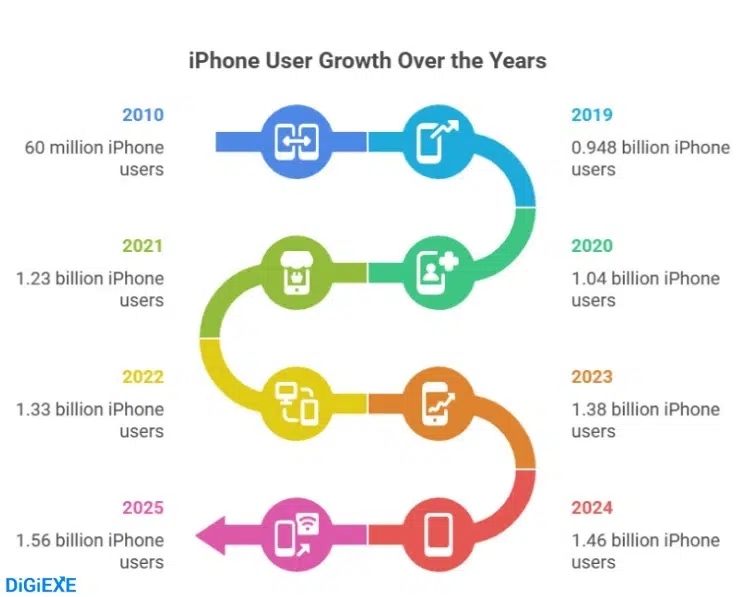
Let’s examine the remarkable growth of iPhone users globally:
| Year | Number of iPhone Users |
| 2025 | 1.56 billion |
| 2024 | 1.46 billion |
| 2023 | 1.38 billion |
| 2022 | 1.33 billion |
| 2021 | 1.23 billion |
| 2020 | 1.04 billion |
| 2019 | 948 million |
| 2018 | 888 million |
| 2017 | 814 million |
| 2016 | 710 million |
| 2015 | 569 million |
| 2014 | 442 million |
| 2013 | 329 million |
| 2012 | 206 million |
| 2011 | 115 million |
| 2010 | 60 million |
Sources: Statista
This consistent upward trend highlights Apple’s successful strategy in expanding its global footprint.
Also read about: Apple Music Users Statistics
The United States: An iPhone Stronghold
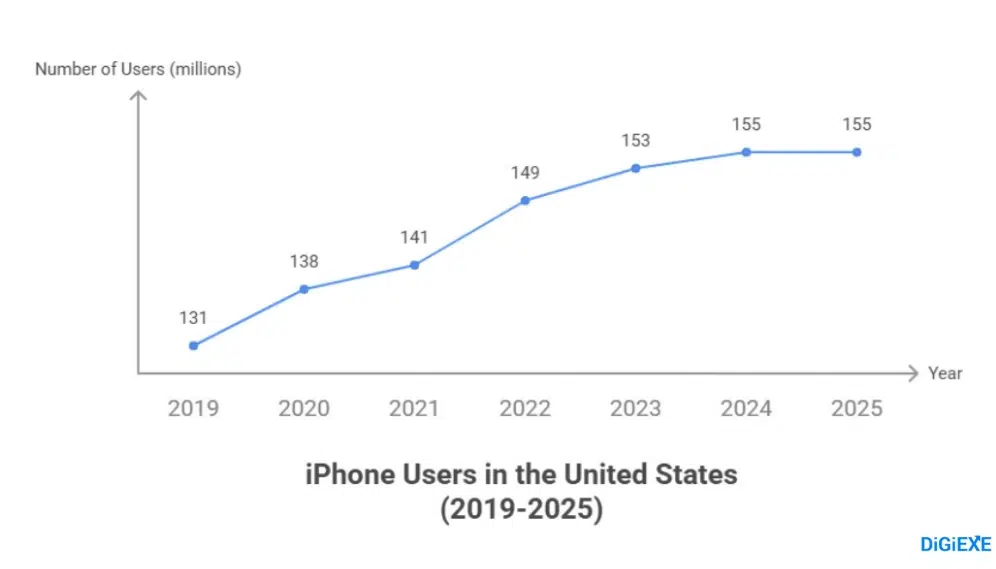
The United States stands out as a particularly strong market for Apple. In 2025, 155 million people in the United States use an iPhone.
This marks a steady 1.3% increase from 2023, and an impressive 76.13% surge since 2014, when the user count was 88 million.
Here’s how iPhone user numbers have grown in the U.S.:
| Year | Number of iPhone Users in the U.S. |
| 2024 | 155 million |
| 2023 | 153 million |
| 2022 | 149 million |
| 2021 | 141 million |
| 2020 | 138 million |
| 2019 | 131 million |
| 2018 | 127 million |
| 2017 | 125 million |
| 2016 | 114 million |
| 2015 | 101 million |
| 2014 | 88 million |
| 2013 | 72 million |
| 2012 | 51 million |
| 2011 | 40 million |
What drives this dominance? iPhones’ premium branding, elegant design, and seamless user experience resonate strongly with American consumers.
The tightly integrated Apple ecosystem, with its proprietary operating system, app store, and suite of services, creates a powerful and addictive experience that fosters a loyal customer base, especially among the growing working class.
This loyalty translates directly into market share: 61% of smartphone users in the United States proudly use an iPhone.
| Year | Share of iPhone Users |
| 2024 | 61.3% |
| 2023 | 58.33% |
| 2022 | 48.7% |
| 2021 | 46.9% |
| 2020 | 45.3% |
| 2019 | 45.2% |
| 2018 | 45.1% |
| 2017 | 44.2% |
| 2016 | 43.5% |
| 2015 | 43.3% |
| 2014 | 42.3% |
Sources: StatCounter.
For businesses targeting the U.S. market, this data is incredibly valuable. Prioritizing iPhone-first messaging, user experience (UX) design, and advertising strategies will likely yield stronger returns.
Also read about: Best Mobile Proxy Providers 2025
The Sales Story: Billions in Revenue
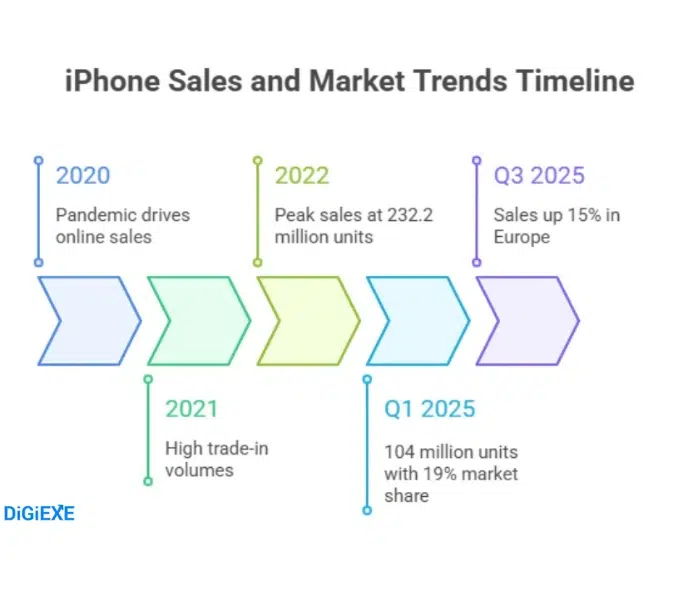
The robust user base directly translates into impressive sales figures for Apple. In 2024, Apple sold an astonishing 232.1 million iPhones worldwide, almost matching the sales of the previous three years combined.
These sales generated a whopping $201.1 billion in revenue in 2024, accounting for 51% of Apple’s total revenue.
Here’s a closer look at iPhone sales over the years:
| Year | Number of iPhones Sold |
| 2024 | 232.1 million |
| 2023 | 231.8 million |
| 2022 | 232.2 million |
| 2021 | 242 million |
| 2020 | 206.1 million |
| 2019 | 191 million |
| 2018 | 208.8 million |
| 2017 | 213.3 million |
| 2016 | 215.4 million |
| 2015 | 231.5 million |
| 2014 | 192.7 million |
| 2013 | 153.4 million |
| 2012 | 135.8 million |
| 2011 | 93.1 million |
The iPhone’s consistent performance in sales highlights its strong market demand and Apple’s ability to innovate and attract new customers year after year.
In the U.S., iPhone sales also show significant strength:
| Year | Number of iPhones Sold in the U.S. |
| 2022 | 124.7 million |
| 2021 | 116.3 million |
| 2020 | 113.5 million |
| 2019 | 105.2 million |
| 2018 | 101.9 million |
| 2017 | 97.2 million |
| 2016 | 90.1 million |
| 2015 | 82.5 million |
| 2014 | 72.3 million |
| 2013 | 57.8 million |
| 2012 | 44.53 million |
The increasing adoption in emerging markets like India is also a key growth driver, with India expected to assemble up to 50% of iPhones by 2027.
This strategic shift in manufacturing further solidifies Apple’s global reach and economic impact.
Market Share: The Global vs. U.S. Divide
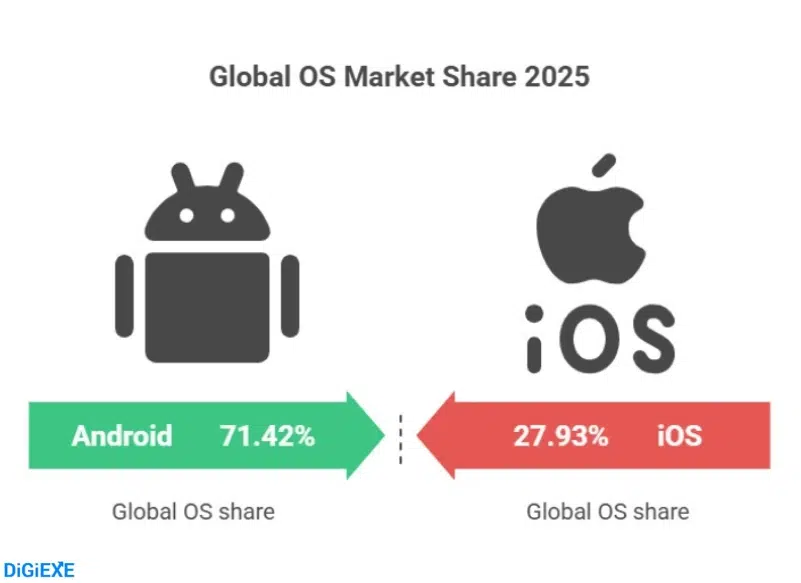
While Android dominates the global mobile operating system market, iOS holds a significant and steadily growing share.
In 2025, iOS maintains 27.93% of the mobile operating system market worldwide, compared to Android’s 71.42%.
| Year | Android Market Share | iOS Market Share |
| 2025 | 71.42% | 27.93% |
| 2024 | 71.67% | 27.73% |
| 2023 | 70.26% | 29.02% |
| 2022 | 71.47% | 27.85% |
| 2021 | 71.89% | 27.34% |
| 2020 | 73.06% | 26.28% |
| 2019 | 75.47% | 22.71% |
| 2018 | 75.45% | 20.47% |
| 2017 | 72.63% | 19.65% |
| 2016 | 69.11% | 19.29% |
However, the U.S. market presents a different picture entirely. Here, iOS takes the lead with 58.64% of the mobile OS market in 2025, while Android trails with 41.1%.
This clear preference for iPhones in the U.S. means that businesses need to tailor their strategies accordingly for American consumers.
| Year | iOS Market Share | Android Market Share |
| 2025 | 58.64% | 41.1% |
| 2024 | 57.09% | 42.62% |
| 2023 | 58.1% | 41.46% |
| 2022 | 56.74% | 42.94% |
| 2021 | 58.58% | 41.11% |
| 2020 | 59.54% | 40.2% |
| 2019 | 55.23% | 44.51% |
| 2018 | 54.82% | 44.73% |
Regionally, iOS shows strong performance in North America (55.53%) and Oceania (51.14%), while having a lower share in Africa (12.43%).
| Region | iPhone Market Share |
| Worldwide | 27.93% |
| North America | 55.53% |
| South America | 16.32% |
| Asia | 19.22% |
| Europe | 31.48% |
| Oceania | 51.14% |
| Africa | 12.43% |
Understanding these regional differences is vital for global marketing campaigns.
The rapid adoption of the latest iOS versions also speaks to user engagement. iOS 17.0 commands a 62.47% market share of Apple mobile devices globally in 2025, demonstrating how quickly users embrace new features and security updates.
| iOS Version | Market Share |
| iOS 17.0 | 62.47% |
| iOS 16 | 24.12% |
| iOS 15 | 8.97% |
| iOS 14 | 1.7% |
| iOS 13 | 0.79% |
| iOS 12 | 1.3% |
| iOS 11 | 0.26% |
| iOS 10 | 0.18% |
This quick adoption rate means developers can confidently target the latest iOS versions, knowing a large percentage of iPhone users will have access to their newest features.
Also read about: Email Marketing Statistics
Who Are the iPhone Users? Demographics and Trends
Demographics paint a clear picture of the typical iPhone user. As of 2025, 31% of iPhone users are female, while 28% are male.
This slight leaning towards female users provides valuable insight for targeted advertising and product development.
The age distribution also reveals interesting patterns: 23% of iPhone users are between 25 and 34 years old, closely followed by 20% in the 18-24 age group. This indicates that iPhones are particularly popular among younger generations and young professionals.
| Age Group | iPhone Users |
| 18 to 24 years | 20% |
| 25 to 34 years | 23% |
| 35 to 44 years | 20% |
| 45 to 54 years | 16% |
| 55+ | 21% |
The Apple ecosystem fosters strong brand loyalty, with 35% of iPhone users also owning an Apple Watch.
This cross-device ownership highlights the strength of Apple’s integrated product strategy and creates opportunities for seamless user experiences across devices.
Revenue Generation: Apple’s Golden Goose
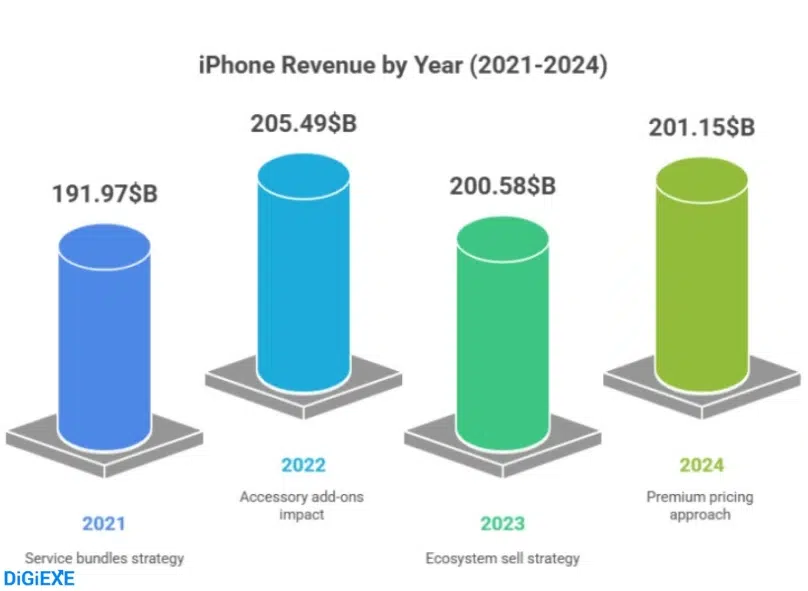
The iPhone remains Apple’s most influential product, consistently contributing over 50% of its total revenue.
In 2024, iPhone sales alone brought in $201.1 billion, solidifying its position as a financial powerhouse for the company.
| Year | iPhone Revenue | Share in Apple’s Total Revenue |
| 2024 | $201.1 billion | 51% |
| 2023 | $200.58 billion | 52.33% |
| 2022 | $205.49 billion | 51.52% |
| 2021 | $191.973 billion | 51.9% |
| 2020 | $137.78 billion | 48.95% |
| 2019 | $142.381 billion | 53.89% |
| 2018 | $166.27 billion | 61.80% |
| 2017 | $141.32 billion | 60.46% |
| 2016 | $136.7 billion | 62.48% |
| 2015 | $155.04 billion | 65.95% |
Apple’s overall annual revenue also continues to climb, demonstrating its broad market strength:
| Year | Revenue |
| 2024 | $391.04 billion |
| 2023 | $383.29 billion |
| 2022 | $394.34 billion |
| 2021 | $365.81 billion |
| 2020 | $274.52 billion |
| 2019 | $260.18 billion |
| 2018 | $265.6 billion |
| 2017 | $229.24 billion |
| 2016 | $215.64 billion |
| 2015 | $233.72 billion |
| 2014 | $182.79 billion |
| 2013 | $170.9 billion |
| 2012 | $156.51 billion |
The strong financial performance underscores the enduring value and profitability of the iPhone product line.
iPhone Adoption Rates: The Latest Models Take Hold
New iPhone models quickly find their way into users’ hands. The iPhone 15 Pro Max boasted the highest global adoption rate of 3.64% in January 2024, closely followed by the iPhone 15 Pro at 2.3%.
This rapid uptake demonstrates the excitement surrounding new releases and users’ eagerness to experience the latest technology.
| Month & Year | iPhone 15 | iPhone 15 Plus | iPhone 15 Pro | iPhone 15 Pro Max |
| January 2024 | 1.66% | 0.66% | 2.3% | 3.64% |
| December 2023 | 1.29% | 0.51% | 2.37% | 3.06% |
| November 2023 | 0.85% | 0.35% | 1.69% | 2.11% |
| October 2023 | 0.58% | 0.23% | 1.21% | 1.25% |
| September 2023 | 0.12% | 0.05% | 0.31% | 0.27% |
For businesses, this means that optimizing apps and services for the newest iPhone models and iOS versions is crucial to reach a significant and engaged segment of the user base.
App Ecosystem: Where iPhone Users Spend Their Time and Money
The Apple App Store is a vibrant marketplace, with millions of apps catering to every need. In June 2023, the Google App led downloads with over 6.36 million, followed by CapCut (6.16 million) and ChatGPT (4.65 million).
| iPhone App | Number of Downloads |
| 6.36 million | |
| CapCut | 6.16 million |
| ICOCA | 5.23 million |
| ChatGPT | 4.65 million |
| TikTok | 4.12 million |
| WhatsApp Messenger | 3.91 million |
| YouTube | 3.66 million |
| 3.54 million | |
| Google Chrome | 2.69 million |
| Netflix | 2.36 million |
| Gmail | 2.29 million |
| Spotify | 2.23 million |
| Temu | 1.94 million |
This indicates a strong demand for utility, social media, and entertainment apps among iPhone users.
Beyond downloads, the App Store is a major revenue generator. DouYin (the Chinese version of TikTok) was the highest-grossing app in June 2023, bringing in $372.08 million. TikTok followed with $324.3 million, and Roblox generated $129.95 million.
| iPhone App | Revenue |
| DouYin | $372.08 million |
| TikTok | $324.3 million |
| Piccoma | $228.32 million |
| Honor of Kings | $165.75 million |
| Tencent Video | $165.71 million |
| Roblox | $129.95 million |
| Honkai: Star Rail | $104.8 million |
| Max | $103.93 million |
| Iqiyi | $96.54 million |
| Honkai: Star Rail | $94.73 million |
| LINE | $93.24 million |
This immense revenue generation highlights the willingness of iPhone users to spend on in-app purchases and subscriptions, making the App Store a lucrative platform for developers and businesses.
Global in-app purchase revenue across iOS and Google Play hit $150 billion in 2024, a 13% year-over-year increase, showing the growing monetization potential within apps.
What Are iPhone Users Asking For? Insights from Quora and Reddit
Beyond the numbers, understanding the conversations happening online provides crucial qualitative data. On platforms like Quora and Reddit, iPhone users frequently discuss:
- Battery Health and Longevity: Users consistently ask for tips on maximizing battery life, understanding battery health percentages, and whether replacing a battery is worthwhile. This indicates a desire for devices that last longer and perform consistently.
- iOS Updates and Features: Discussions often revolve around new features introduced in the latest iOS versions, bug reports, and wishes for future functionalities. Privacy controls and customization options are hot topics.
- App Recommendations and Alternatives: Users actively seek recommendations for specific apps for productivity, photo editing, and entertainment, and often look for free or more affordable alternatives to popular paid apps.
- Hardware Durability and Repairability: With the cost of iPhones, users are increasingly interested in the durability of new models and the ease and cost of repairs, especially for screens and cameras.
- Ecosystem Integration: Many threads explore how to best utilize the iPhone with other Apple devices like Apple Watch, AirPods, and Macs, showcasing the value users place on a seamless ecosystem. Questions about HomeKit integration and smart home devices are also common.
- Privacy and Security: In the age of data concerns, iPhone users frequently discuss Apple’s privacy features, how to enhance personal security settings, and compare Apple’s approach to privacy with other platforms. The concern about AI privacy, with 40% of consumers worried in 2025 (up 7% from 2024), is a significant point of discussion.
- Price and Value Perception: While many are loyal, discussions around the high price point of new iPhones, trade-in values, and financing options are prevalent. The average cost of an iPhone in 2025 is $1,048, compared to Android’s $293, making price a major consideration for 62% of users when upgrading. This shows users are seeking justification for the premium price.
These discussions reveal that iPhone users are sophisticated consumers who value longevity, seamless experiences, strong privacy, and relevant, well-integrated features. They are willing to pay a premium, but they expect high quality and ongoing support.
Also Read:
- Online Advertising Statistic
- WhatsApp Users Statistics
- Mobile App Download Statistics
- Online Gaming Statistics
- ChatGPT Statistics
Conclusion: Loyalty and Innovation
Apple’s iPhone is not just a device; it is a cultural phenomenon that continues to shape the mobile landscape. The consistent growth in iPhone users & sales statistics 2025 confirms its enduring appeal.
Apple’s ability to combine exceptional hardware with a polished and secure software experience creates a powerful ecosystem that retains users and attracts new ones.
The future looks bright for iPhone. With strong generational loyalty (88% of U.S. teenagers use iPhones) and a focus on integrating advanced features like Apple Intelligence (54% of upgraders see it as very important), Apple is well-positioned to maintain its competitive edge.
The data unequivocally shows that the iPhone is a dominant force in the mobile world. Businesses and individuals who understand these trends and adapt their strategies will be best equipped to harness the power of the Apple advantage.