

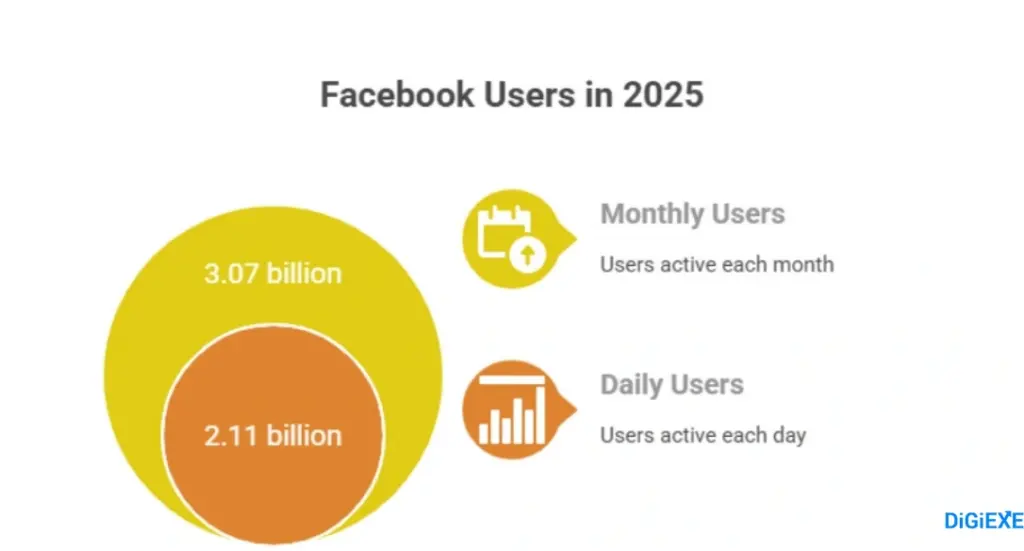
Facebook dominates the digital landscape in 2025, commanding 3.07 billion monthly active users (MAUs) as marketers, entrepreneurs, community builders, and content creators harness facebook users statistics 2025 to launch viral campaigns, build loyal groups, and generate revenue through targeted ads and marketplaces.
The platform engages 2.11 billion daily active users (DAUs), with sessions averaging 10 minutes and 12 seconds, while India leads with 581.6 million users—40.08 percent penetration—and the United States follows at 279.8 million, or 81 percent.
Downloads surpass 5 billion on Google Play alone, with 553 million in 2023 and 571 million in 2024. Users aged 25-34 dominate at 24.97 percent to 31.2 percent, males at 55.26 percent to 56.5 percent.
Revenue soars to $164.5 billion in 2024, projecting $180 billion+ in 2025, fueled by AI recommendations filling 20 percent of feeds.
Readers eager to understand Facebook users and leverage them for benefits—like optimizing ad spends for 23.5 percent digital market share or growing groups with 1.8 billion monthly participants—discover here demographics, regional hotspots, engagement hacks, and fresh Quora-Reddit trends.
From 77.6 percent overlap with Instagram to real-time translations in 200 languages, these insights empower you to transform connections into cash amid 67,317 employees and $62.3 billion profits.
Monumental User Milestones
Facebook reaches 3.07 billion MAUs in 2025, up 3 percent from 2.96 billion in 2022, capturing 59.38 percent of 5.17 billion global social users.
Growth spans 120.86 percent over a decade from 1.39 billion in 2014.
This MAU evolution table tracks progress:
| Year | MAUs (Billions) | Year-over-Year Growth |
| 2025 | 3.07 | +0.65% |
| 2024 | 3.08 | +1.64% |
| 2023 | 3.03 | +2.37% |
| 2022 | 2.96 | +1.72% |
| 2021 | 2.91 | +3.93% |
| 2020 | 2.80 | +12% |
| 2019 | 2.50 | +7.76% |
| 2018 | 2.32 | +8.92% |
| 2017 | 2.13 | +14.52% |
| 2016 | 1.86 | +17% |
| 2015 | 1.59 | +14.39% |
| 2014 | 1.39 | – |
Creators schedule posts during growth spurts to maximize reach.
DAUs hit 2.11 billion, 68.72 percent of MAUs, rebounding from a 1 million dip in Q4 2021.
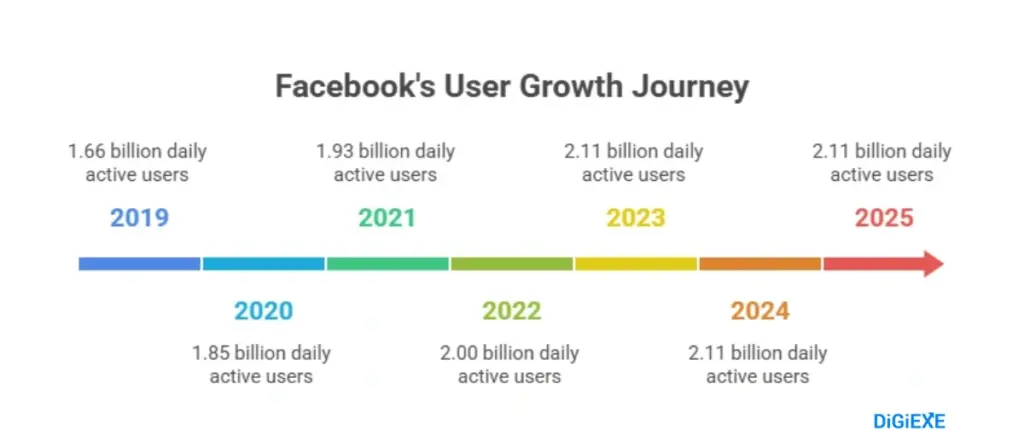
This DAU table highlights consistency:
| Year | DAUs (Billions) |
| 2025 | 2.11 |
| 2024 | 2.145 |
| 2023 | 2.06 |
| 2022 | 2.00 |
| 2021 | 1.93 |
| 2020 | 1.85 |
| 2019 | 1.66 |
| 2018 | 1.52 |
| 2017 | 1.40 |
| 2016 | 1.23 |
Businesses post daily to engage this core audience.
Also read about: Best Facebook Proxies 2025
Regional Powerhouses: India and Beyond Drive Dominance
India boasts 581.6 million users, 40.08 percent penetration, with males 31.5 percent, females 68.5 percent.
The U.S. claims 279.8 million, projected to 262.8 million by 2028. Indonesia (174 million), Brazil (175.1 million), Mexico (111.4 million) follow.
This top countries table reveals targeting gold:
| Rank | Country | Users (Millions) | Penetration (%) | Male (%) | Female (%) | Strategy Tip |
| 1 | India | 581.6 | 40.08 | 31.5 | 68.5 | Hindi ads, local festivals |
| 2 | U.S. | 279.8 | 81 | 53.8 | 46.2 | Premium groups, e-commerce |
| 3 | Brazil | 175.1 | 82.6 | 55.3 | 44.7 | Portuguese videos, live sales |
| 4 | Indonesia | 174 | 61.38 | 46.2 | 53.8 | Bahasa memes, marketplace |
| 5 | Mexico | 111.4 | 85.13 | 52.1 | 47.9 | Spanish polls, brand research |
| 6 | Philippines | 102.3 | 88.32 | 53 | 47 | Highest penetration: family chats |
| 7 | Vietnam | 86.1 | 85.27 | 51.1 | 48.9 | Youth reels |
Marketers localize in India for 581.6 million reach, boosting conversions 53 percent via live chat.
U.S. projections:
| Year | U.S. Users (Millions) |
| 2028 | 262.8 |
| 2027 | 259.86 |
| 2026 | 256.78 |
| 2025 | 279.8 |
| 2024 | 250.2 |
Also read about: Instagram Statistics
Download Dominance: 5 Billion+ and Rising
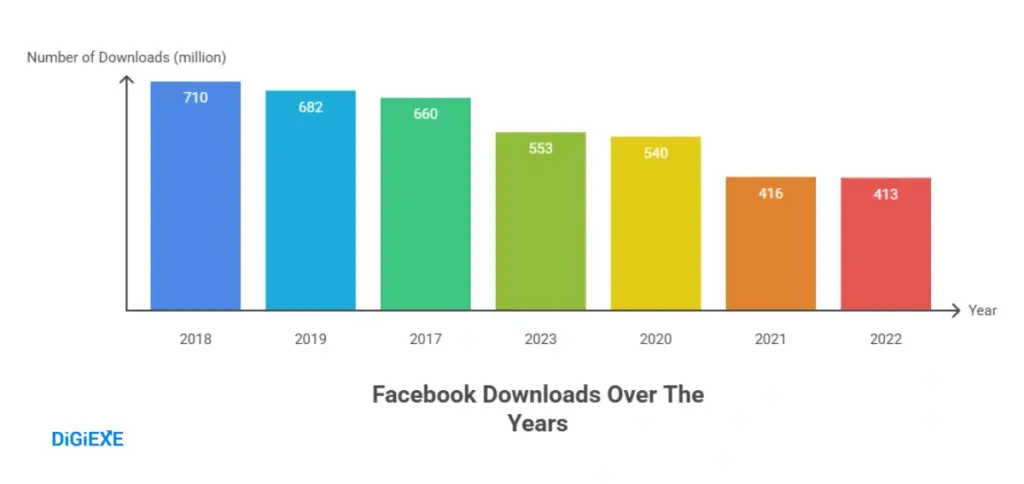
Cumulative Play Store downloads exceed 5 billion. 2024 sees 571 million, 2023 553 million.
This downloads table forecasts:
| Year | Downloads (Millions) |
| 2024 | 571 |
| 2023 | 553 |
| 2022 | 413-449 |
| 2021 | 416 |
| 2020 | 540 |
| 2019 | 682 |
App developers promote via cross-platform for installs.
Also read about: YouTube Statistics
Engagement Essentials: Time, Devices, and Interactions
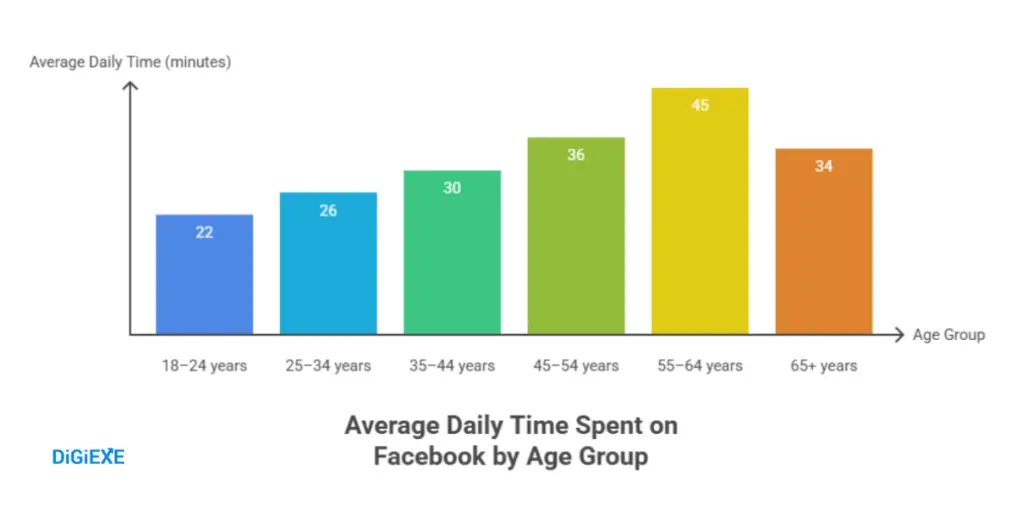
Sessions average 10 minutes 12 seconds. 55-64 spend 45 minutes daily, 18-24 just 22 minutes. Monthly Android: 18 hours 45 minutes, UAE tops at 31 hours 8 minutes.
This time-by-age table optimizes scheduling:
| Age Group | Daily Minutes |
| 18-24 | 22 |
| 25-34 | 26 |
| 35-44 | 30 |
| 45-54 | 36 |
| 55-64 | 45 |
| 65+ | 34 |
Mobile-only access: 52.66 percent global, 81.8 percent U.S. phones.
U.S. devices:
| Device | Share (%) |
| Mobile only | 81.8 |
| Both | 16.7 |
| Desktop only | 1.5 |
Pages post 1.75 daily: links 42.9 percent-38.9 percent, photos 34.3 percent-30.2 percent, videos 19.3 percent-28.6 percent.
Engagement rates:
| Post Type | Rate (%) |
| Videos | 0.30 |
| Reels | 0.26 |
| Photos | 0.24 |
| Links | 0.06 |
Creators prioritize videos for 0.30 percent interaction.
Reasons: messaging 72.4 percent, photos/videos 63.2 percent, brands 53 percent.
Also read about: WhatsApp Users Statistics
Business Bonanza: 200 Million Companies and Marketplace Magic
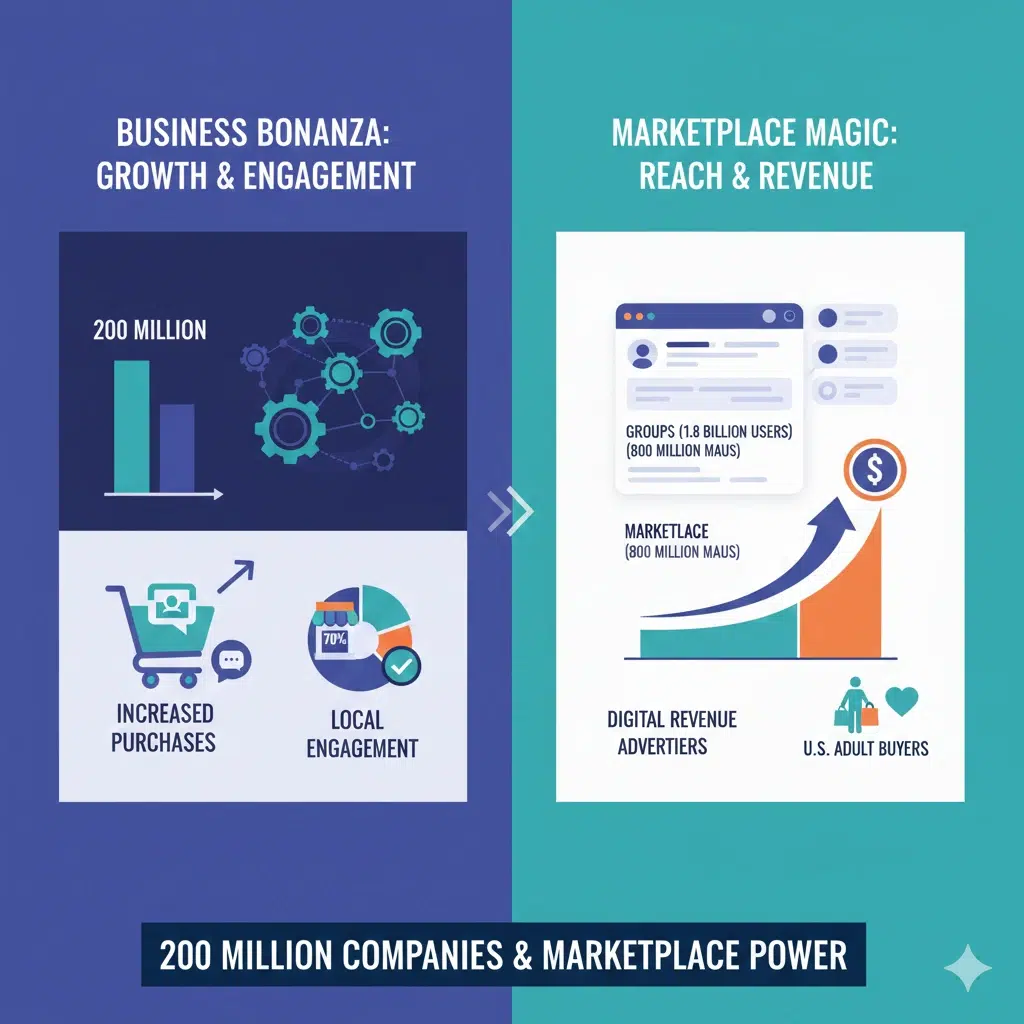
Over 200 million businesses use tools. 18.3 percent U.S. adults buy via Facebook. 70 percent visit local pages weekly. Live chat boosts purchases 53 percent.
Marketplace: 800 million MAUs. Groups: 1.8 billion users, 10 million+ groups.
Advertisers tap 23.5 percent digital revenue.
AI Advancements: Recommendations and Translations
AI fills 20 percent feeds. NLLB-200 translates 200 languages, 70 percent+ accurate for Indian. MMS: 1,100+ languages speech. RSC: 16,000 GPUs. 1,000+ models released.
Businesses use real-time translation for global posts.
Revenue Rivers: $164.5 Billion and ARPU Insights
2024 revenue: $164.5 billion, up 21.9 percent. Q2 2025: $47.51 billion, Q1 $42.31 billion.
This revenue table projects:
| Period | Revenue (Billions USD) |
| Q2 2025 | 47.51 |
| Q1 2025 | 42.31 |
| 2024 | 164.5 |
| 2023 | 134.9 |
| 2022 | 116.6 |
U.S./Canada: $72 billion, 43.7 percent total.
ARPU global: $13.12 Q4 2023. Regions:
| Region | ARPU (USD) |
| U.S./Canada | 68.44 |
| Europe | 23.14 |
| Asia-Pacific | 5.52 |
| Rest | 4.50 |
Profit: $62.3 billion 2024, up 59 percent.
Employees: 67,317, down 22.16 percent.
Platform Overlaps: Multi-App Mastery
77.6 percent use Instagram, 73.4 percent YouTube, 72.9 percent WhatsApp, 52.1 percent TikTok.
Cross-promote for amplified reach.
Quora and Reddit Revelations: Latest User Buzz
Quora asks “Will Facebook hit 3.5 billion users by 2030?”—experts say yes via AI groups, metaverse. Reddit’s facebook debates 3.07 billion MAUs, praising 2.11 billion DAUs but critiquing ad overload.
India celebrates 581.6 million, sharing marketplace hacks for sales. Quora queries “Best ways to grow Facebook groups in 2025?”—advise AI translations, reels.
technology highlights NLLB-200 for 200 languages, aiding global brands.
Incorporate MMS for voice posts in low-resource areas.
Strategic Playbook: Benefits for Every User
Entrepreneurs sell via Marketplace to 800 million. Creators monetize reels at 0.26 percent. Marketers target India’s 581.6 million with local ads.
Community managers grow groups to 1.8 billion users. Privacy-focused enable translations securely.
Developers integrate AI models for apps.
FAQs About Facebook User Statistics
1. How many Facebook users exist globally in 2025 and what fuels the growth?
Facebook commands 3.07 billion monthly active users in 2025, with 2.11 billion daily, fueled by AI recommendations in 20 percent of feeds and marketplace for 800 million, enabling creators to viralize content and businesses to target precisely.
2. Which countries lead in Facebook users and how can marketers capitalize?
India tops with 581.6 million users at 40.08 percent penetration, U.S. 279.8 million; marketers capitalize by localizing ads in Hindi or English, using live chat for 53 percent higher purchases in these markets.
3. What demographics shape Facebook users in 2025 and why do they matter for content?
Users aged 25-34 comprise 24.97 percent to 31.2 percent, males 55.26 percent to 56.5 percent; they matter as videos engage 0.30 percent, guiding creators to tailor reels for this group to boost interactions and monetization.
4. How does Facebook's revenue and ARPU in 2025 benefit advertisers?
Facebook earns $164.5 billion in 2024, ARPU $68.44 in U.S./Canada; advertisers benefit from 23.5 percent digital share, placing AI-optimized ads to 3.07 billion for high ROI in premium regions.
5. Why do users spend time on Facebook in 2025 and how can businesses engage them?
Users average 10 minutes 12 seconds per session for messaging 72.4 percent and brands 53 percent; businesses engage via groups for 1.8 billion users, posting videos daily to capture 45 minutes from 55-64 demo.
Also Read:
- YouTube Statistics
- Marketing Automation Statistics
- Digital Marketing Statistics
- Microsoft Teams Statistics
- Link Building Statistics
Conclusion
In conclusion, Facebook’s user base continues to grow in 2025, with 3.07 billion monthly active users, driven by AI, targeted ads, and a thriving marketplace.
India leads in user numbers, providing a major opportunity for localized marketing. With a strong focus on younger users and daily engagement, Facebook remains a powerful platform for businesses, content creators, and marketers.
By leveraging AI tools, optimizing ads, and engaging through videos and groups, businesses can maximize their reach and profitability in this ever-evolving digital landscape.