
Conversion Rate Optimization (CRO) is key to digital success in 2025, helping businesses turn visitors into loyal customers with data-driven strategies.
CRO boosts sales by refining user experiences, streamlining funnels, and maximizing existing traffic without additional ad spend.
With tools like AI-driven personalization and A/B testing, businesses can increase conversions by up to 202%. In 2025, CRO delivers an average 223% ROI, and mobile optimization can reduce bounce rates by 20%.
The global CRO software market is set to reach $5.07 billion, with businesses dedicating up to 30% of marketing budgets here.
CRO involves systematic testing to align with user psychology, ensuring higher engagement and conversions.
Top CRO Statistics [Year]: Quick Wins
CRO statistics 2025 underscore the platform’s maturation, with the global average website conversion rate steady at 3.68%, signaling room for optimization even among leaders.
Businesses embracing CRO tools report a robust 223% ROI on average, far outpacing traditional ad spends, while monthly tool investments hover around $2,000 for enterprises— a fraction of the $800-$10,000 agency fees that yield similar uplifts.
E-commerce sites, facing fierce rivalry, average 2.7% conversions, but top performers hit 11% through tactics like UX testing, adopted by 64% of marketers.
Paid search channels shine at 3.2% rates, with finance leading at 15.6%, encouraging you to refine keywords for high-intent traffic. Bounce rates plague many at 26-70% overall, spiking to 51% on mobile, yet a 1-second load shave drops this 32%, directly benefiting impatient users.
Adoption lags: 68% of small businesses skip CRO, missing 30% budget allocations that could document strategies (only 39.6% do).
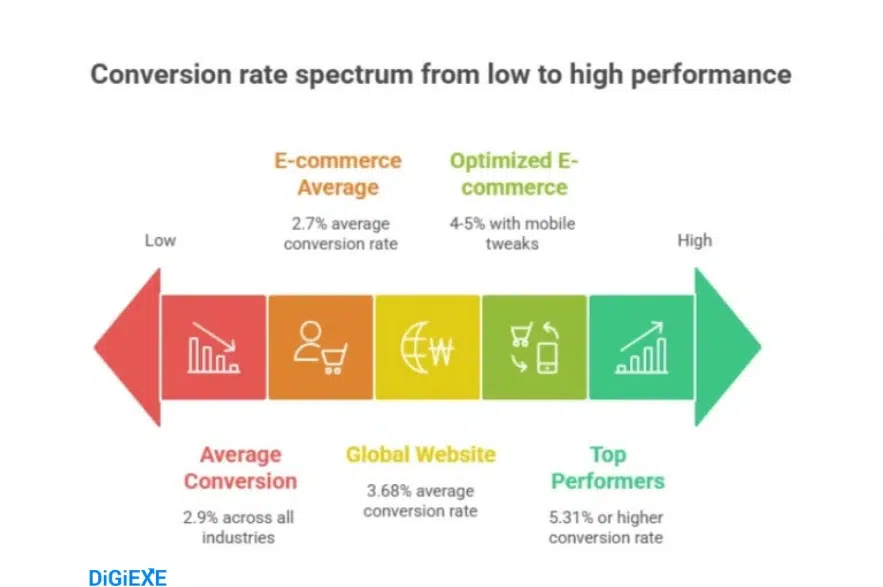
For you, these figures mean starting small—A/B headlines alone boosted Bing’s revenue 12%—to climb into the top 25% with 5.31% rates.
The table below highlights pivotal CRO statistics 2025 for immediate application:
| Metric | 2025 Value/Trend | Benefit for Implementation |
| Average Conversion Rate (All) | 2.9% | Baseline for benchmarking |
| E-commerce Average | 2.7% | Target 3.5%+ via personalization |
| Global Website Average | 3.68% | Aim for 5% with UX tweaks |
| Paid Search Rate | 3.2% | Refine ads for finance (15.6%) |
| CRO ROI | 223% | Justify 30% budget allocation |
| Monthly Tool Spend | $2,000 avg. | Scale from $10 tools |
| Bounce Rate (Mobile) | 51% | Cut 20% with speed optimizations |
These snapshots guide you to prioritize high-ROI areas, like mobile, where 73% traffic demands attention for 202% personalization gains.
Also read about: Content Marketing Statistics
General CRO Statistics [Year]: Foundations for Effective Optimization
Businesses grapple with accountability in CRO, where 40% lack dedicated oversight, hindering progress amid 79% lead non-conversions—56% unqualified from the start.
Positive in-store experiences sway 63% to online buys, blending omnichannel for trust. Marketers face hurdles: 55% struggle with converting leads, and 82% find tracking challenging, yet post-COVID, decision-maker buy-in and process refinements top barriers.
For your benefit, assign a CRO lead or team (30% do successfully) to audit funnels, turning unqualified traffic into 6-12% inbound lifts. Document strategies—only 39.6% worldwide—to sustain gains, as 173 marketers report over 1,000% ROI post-implementation.
Accountability table:
| Responsibility Model | % of Companies | Recommendation for You |
| No One Accountable | 40% | Designate a CRO champion |
| Dedicated Team | 30% | Collaborate for holistic tests |
| Single Person | 29% | Scale with tools for efficiency |
Quora users in 2025 ask “Why do 79% leads fail?”—answers stress qualification via popups, boosting readiness 20%.
Bounce Rate Statistics 2025: Taming Exits for Higher Engagement
Bounce rates average 26-70% across sectors, with mobile at 51% due to slow loads—1-3 seconds hikes probability 32%, escalating to 123% at 10 seconds. Apparel sees 45%, SaaS 65%, demanding swift fixes like lazy loading to retain 20% more visitors.
You benefit by auditing speeds: compress images for 15% conversion bumps, as 67% prefer mobile apps over sites. Sector-specific tweaks—e.g., intuitive navigation for food/beverage (55-65%)—cut exits, funneling users deeper.
Bounce rate table by sector:
| Sector | Average Bounce Rate (%) | Optimization Tip |
| Food & Beverage | 55-65 | Fast recipe visuals |
| Healthcare | 60 | Clear appointment CTAs |
| Apparel | 45 | Mobile zoom on products |
| Electronics | 54 | Quick spec comparisons |
| Financial Services | 50 | Secure login prompts |
| SaaS | 65 | Demo video on load |
Reddit’s r/webdev in 2025 debates “Mobile bounce fixes?”—consensus: AMP pages slash 51% rates 30%.
Also read about: Digital PR Statistics
CRO Adoption Statistics 2025: Bridging the Gap for Small Businesses
Adoption reaches 69% for experience tools, but 68% small firms lag, missing personalization (61%) and content testing (57%).
Only 53% allocate >5% budgets, yet $2,000 monthly tools promise 223% ROI. Global software market grows 10% CAGR to $1,932 million by 2026, from $771 million in 2018.
Start with free A/B like Google Optimize: UX testing lifts 30%, per 64% adopters. Document (39.6% do) for continuity, as <0.11% sites test actively—join them for top-quartile 5.31% rates.
Adoption techniques table:
| Technique | Adoption Rate (%) | Expected Lift for You |
| UX Testing | 64 | 30% conversion increase |
| Personalization | 61 | 202% sales boost |
| Content Testing | 57 | 12% revenue from headlines |
| A/B Testing Overall | 69 | 223% ROI potential |
Quora’s “CRO for SMBs 2025?” highlights free tools like Hotjar for 20% quick wins.
Budget and ROI in CRO 2025: Investing Wisely for Exponential Returns
CRO claims 30% marketing budgets, with tools $10-500 monthly, agencies $800-10,000. Averages: $2,000 tools for large firms, yielding 223% ROI—5% hit <223%, but 173 report >1,000%. Market: $5.07B by 2025.
Allocate 5% initially: test CTAs for 121% lifts. Track via analytics for sustained 3600% email ROI parallels.
Budget table:
| Spend Type | Average Cost/Month | ROI Potential |
| CRO Tools | $2,000 | 223% |
| Agency Services | $800-10,000 | >1,000% for top performers |
| Basic Tools | $10-500 | 15% from speed alone |
Reddit r/marketing asks “CRO budget 2025?”—users suggest 10% for AI, reaping 30% engagement.
Average Conversion Rates 2025: Setting Realistic Benchmarks
Sites average 2-5%, with >5% excellent; top 25% at 5.31%, elite 11-12%.
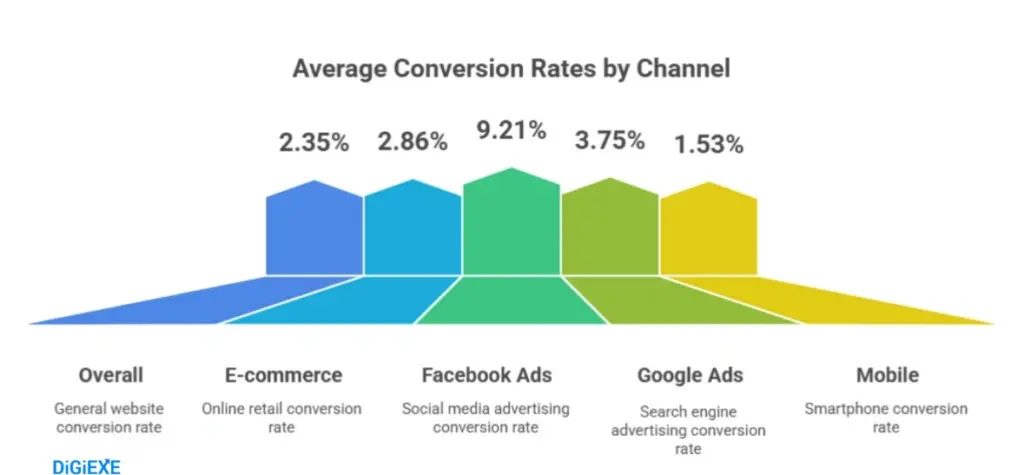
Desktop: 14%, mobile: 1.53%, tablet: 3.36%. Ads: Facebook 9.21%, Google 3.75%, Instagram 1.5%. B2B: 75% prioritize rates.
Inbound boosts 6-12%; finance paid: 15.6%, B2B services low 0.9%. Benchmark: aim 3.5% e-commerce via personalization.
Channel rates table:
| Channel/Source | Average Rate (%) | Strategy for Improvement |
| Desktop | 14 | Full-funnel visuals |
| Mobile | 1.53 | Thumb-friendly CTAs |
| Facebook Ads | 9.21 | Audience retargeting |
| Google Ads | 3.75 | Keyword intent matching |
| 1.5 | Story polls |
Quora: “Good CRO rate 2025?”—3-5% baseline, 10%+ elite.
CRO Statistics by Industry 2025: Tailored Tactics for Your Niche
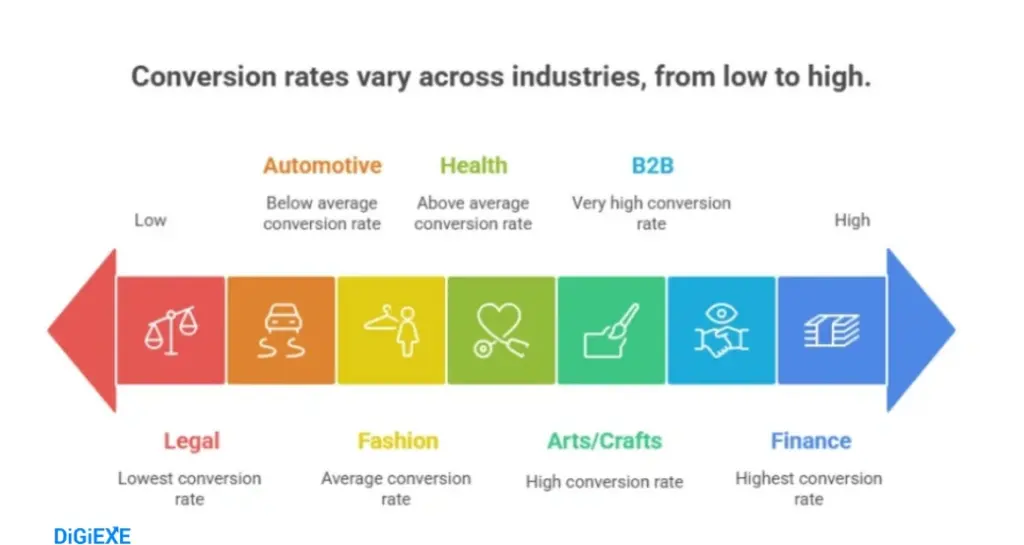
B2B e-commerce: 4%, overall B2B 2.23-4.31%; legal 1.07%, finance 5.01-15%, automotive 2.5%, services 7%. E-commerce: 1.84-3.71%, arts/crafts highest 3.79%.
Adapt: finance refines trust signals for 15%; e-commerce tests carts for 2.7% base.
Industry table:
| Industry | Average Rate (%) | Key Tactic |
| B2B eCommerce | 4.0 | Demo requests |
| Legal | 1.07 | Case studies |
| Finance | 5.01-15 | Secure badges |
| Automotive | 2.5 | Virtual tours |
| B2B Services | 7.0 | Free audits |
| E-commerce Overall | 1.84-3.71 | Cart recovery emails |
E-commerce sub-markets: health 3.62%, pets 3.28%, fashion 2.44%.
Reddit r/ecommerce: “Industry CRO 2025?”—fashion tests visuals for 3.2%.
E-commerce CRO Statistics 2025: From Cart to Cash
E-commerce averages 2.5-3%, fashion 3.2%, health 2.8%, luxury appliances 0.8%. Q1 2024: apparel 2%, toys 1.7%, electronics 1.4%. Personalization: 30%+ via AI; 1s faster: 7% up, 2s: 15%.
Shop Pay: 50% lift; FSAstore: 53.8% from form cuts. Cart abandonment: 85.65% mobile.
Sub-sector table:
| Sub-Market | Rate (%) | Trend 2025 |
| Arts/Crafts | 3.79 | User-generated content |
| Health/Well-Being | 3.62 | Wellness bundles |
| Pet Care | 3.28 | Subscription nudges |
| Fashion/Accessories | 2.44 | AR try-ons |
| Food/Drink | 2.37 | Impulse CTAs |
Quora: “E-com CRO 2025?”—AI for 202% personalization.
Email and Landing Page CRO 2025: High-Impact Channels
Emails: 361B daily, 3.61B convert (17.75% avg., 15.22% CTR); personalized subjects: 22% opens. Cart recovery: 8.24%.
Landing pages: 2-5% good, top 12.9% e-com, 18.1% entertainment; A/B: 30% lift. B2B: 57% deem rates key, avg 9.7%.
Test headlines for 12% revenue; signups: 23%.
Channel table:
| Type | Avg Rate (%) | Optimization |
| Email Overall | 17.75 | Dynamic subjects |
| Cart Recovery Emails | 8.24 | Urgency timers |
| Landing Pages (All) | 9.7 | Hero videos |
| E-com Landings | 12.9 | Trust badges |
Reddit r/Emailmarketing: “2025 CRO emails?”—22% open boosts via AI.
Mobile CRO Statistics 2025: Dominating the Device Shift
Mobile: 73% traffic, 2.89% e-com rate (June 2024); abandonment 85.65%. 1s delay: 20% drop; negative UX: 62% less future buys.
67% prefer apps; optimize for 88% sales by 2027.
Mobile table:
| Metric | Stat 2025 | Fix for Gains |
| Traffic Share | 73% | Responsive design |
| E-com Rate | 2.89% | One-click checkout |
| Abandonment | 85.65% | Free shipping thresholds |
| App Preference | 67% | Push notifications |
Quora: “Mobile CRO trends?”—lazy loading for 20% retention.
CRO as a Long-Term Strategy 2025: Sustaining Gains with Trends
CRO thrives ongoing: personalization re-engages 50%, sales +21%. Stikky: 15% via Shopify kits. AI: 30% firms by 2025 for testing.
Hybrid commerce blurs lines; social/video: combine for lifts.
Trends table:
| Trend 2025 | Impact (%) | Your Application |
| AI Personalization | +202 sales | Dynamic content |
| Video Marketing | 5x engagement | Product demos |
| Hybrid Commerce | N/A | Omnichannel funnels |
| Social Proof | N/A | UGC testimonials |
Reddit r/growthhacking: “CRO long-term?”—quarterly audits for 30% yearly.
Latest from Quora and Reddit
Quora threads in 2025 probe “What CRO tools dominate now?” with users praising VWO for 30% A/B lifts and Hotjar for heatmaps slashing bounces 20%.
Questions like “AI in CRO ethics?” debate bias, but affirm 121% CTA gains. Reddit’s r/CRO discusses “2025 benchmarks?”—e-com 2.5-3% holds, but AI personalization hits 202%.
r/marketing vents on budgets: “30% allocation?”—yes for 223% ROI. r/webdev shares Metricool-inspired comment algorithms boosting dwell 3x. Emerging: AR try-ons (67% app pref), zero-party data for privacy.
FAQs About CRO Statistics
1. How can beginners apply CRO statistics 2025 to improve their website's conversion rate starting today?
Beginners can start by benchmarking their site’s conversion rate, then try quick fixes like A/B testing headlines or speeding up load times. Use free tools like Google Optimize and track progress with heatmaps to improve conversion rates over time.
2. What role does AI play in CRO trends for 2025, and how can businesses leverage it without overspending?
AI enhances personalization, boosting conversions up to 202%. Businesses can use free tools like Shopify’s Smart Traffic or VWO’s AI for targeted optimizations, focusing on a small budget (5-10% of marketing spend) for scalable experiments.
3. How should e-commerce sites optimize for the 2.7% average conversion rate in 2025?
E-commerce sites can increase conversions by focusing on specific tactics like cart recovery emails, simplifying forms, and using AR try-ons. Speeding up load times and implementing one-click checkout can also boost conversions.
4. Why do bounce rates remain high at 51% on mobile in 2025, and what simple fixes deliver quick CRO wins?
Bounce rates stay high due to slow load times and poor UX. Simple fixes like compressing images, using one-click checkout, and enabling AMP pages can reduce bounce rates and improve conversions.
5. How do Quora and Reddit discussions in 2025 influence practical CRO strategies for small businesses?
Discussions on Quora and Reddit guide small businesses in using free tools and ethical AI for CRO, focusing on personalization and budget-friendly tools to increase ROI. Insights like using AR and testing for engagement help businesses boost conversions without hefty budgets.
Also Read:
- DeepSeek AI Statistics
- iPhone Users Statistics
- Online Advertising Statistics
- Digital Marketing Statistics
- Latest AI Statistics
Conclusion
CRO statistics for 2025 reveal a transformative path for businesses. The average conversion rate across industries is 2.9%, with a 223% ROI from dedicated tools.
Strategic optimizations, like AI-driven personalization, mobile speed improvements, and A/B testing, can boost e-commerce rates from 2.7% to over 11%.
These strategies address mobile bounce rates of 51% and unlock revenue from existing traffic, reducing the need for more ad spend.
With 69% adoption of experience tools and up to 30% of budgets allocated to CRO, businesses can stay ahead. Insights from Quora and Reddit highlight trends that empower your digital presence, driving growth, loyalty, and long-term success.
Source: VWO, WordStream.