
Smartphones shape our days in 2025, from snapping family moments to closing deals on the go, and the iPhone versus Android showdown remains the ultimate tech showdown with Android powering 3.9 billion devices worldwide while iPhones claim 1.56 billion loyal users.
You navigate this rivalry armed with fresh statistics that show Android’s 72–75% global market share clashing against iPhone’s commanding 58% in the US, where iOS users spend twice as much on apps ($142 billion vs $65 billion annually).
Recent Reddit r/Smartphones threads buzz with users asking “iPhone or Android in 2025 for battery that lasts?”—veterans swear by Android flagships like Samsung Galaxy S25 Ultra’s 5,000mAh cells outpacing iPhone 17 Pro Max by 2–3 hours in mixed use—while Quora debates “iPhone vs Android privacy 2025?” highlight Apple’s 95% trust rating versus Android’s 84%, thanks to features like App Tracking Transparency that block 65% of data grabs.
This exhaustive guide merges the latest iPhone vs Android statistics for 2025 with straightforward advice so you—student snapping selfies, pro chasing productivity, or parent prioritizing safety—pick the platform that fits your wallet, workflow, and world without regret.
Global and Regional Market Share
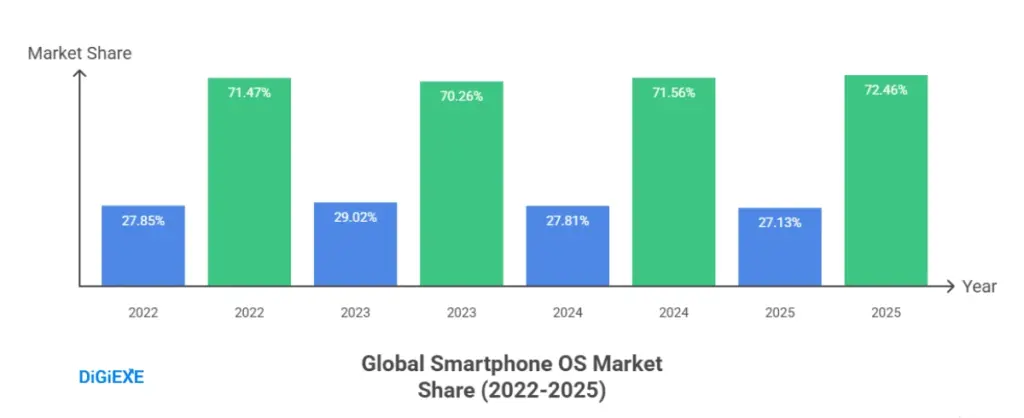
Android captures 72.46% of the global smartphone market in 2025, shipping 295 million units in Q2 alone through brands like Samsung (19.7% share) and Xiaomi (14.4%), while iOS holds 27.13% with Apple’s 46.4 million iPhone shipments (15.7% share).
This dominance stems from Android’s affordability and variety—devices from $100 budget flips to $1,500 foldables—making it king in emerging markets like India (96.67% share) and China (77.44%).
You thrive on Android if you live in Asia or Africa, accessing 2.44 million Google Play apps tailored to local needs, from Hindi voice assistants to ultra-cheap 5G plans that save $50–$100 yearly versus iPhone carrier locks.
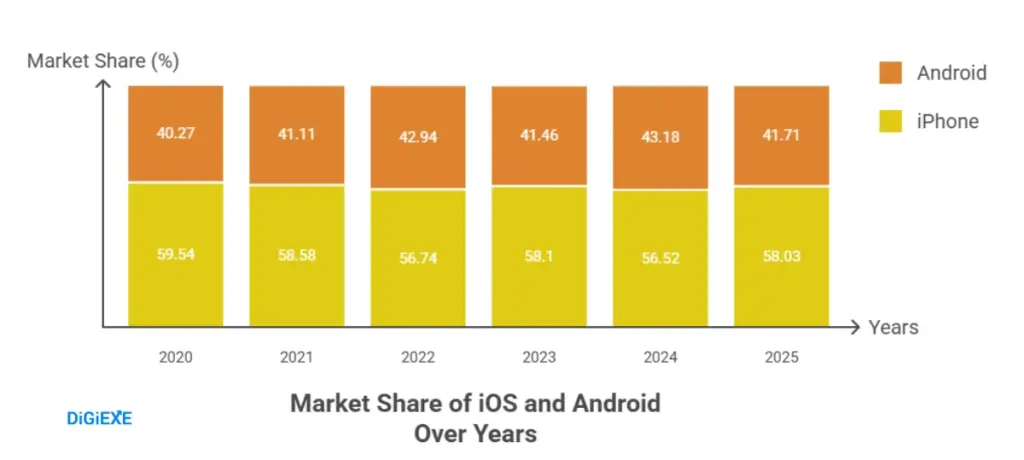
The US flips the script with iOS at 58.03–58.44%, where iPhones outsell Android 1.4:1 thanks to cultural cachet and seamless ecosystem ties—think AirDrop sharing files instantly with Macs.
Globally, iOS shines in premium tiers ($400+), owning 57% share and 78% of $1,000+ sales, so you invest in iPhone for resale value that retains 60–70% after two years versus Android’s 40–50%.
Quarterly global shipments table from Q1 2024 to Q2 2025:
| Quarter | Total Shipments (Million) | Android Share % | iOS Share % | Samsung Units (Million) | Apple Units (Million) |
| Q1 2024 | 285.2 | 71.2 | 28.8 | 60.1 | 52.0 |
| Q2 2024 | 292.2 | 70.6 | 29.4 | 53.8 | 45.7 |
| Q3 2024 | 310.5 | 71.5 | 28.5 | 58.0 | 46.4 |
| Q4 2024 | 322.7 (proj.) | 72.0 | 28.0 | 61.4 | 48.0 |
| Q1 2025 | 300.0 (est.) | 72.46 | 27.13 | 62.0 | 49.0 |
| Q2 2025 | 295.2 | 72.46 | 27.13 | 58.0 | 46.4 |
r/Android users gush over 2025’s foldables like Galaxy Z Fold7 (20% sales growth) for multitasking that crushes iPhone’s single-screen limits, saving pros hours daily.
Also read about: iPhone Users Statistics
User Base Breakdown
Android boasts 3.9 billion active users in 2025—over 70% of the 5.5 billion global smartphone population—thanks to open-source flexibility powering everything from $50 feature phones in rural India to $1,200 Pixels in Silicon Valley.
iPhone counters with 1.56 billion users, projected from 1.46 billion in 2024, concentrated in wealthier pockets where 1 in 3 North Americans swears by iOS for its “it just works” vibe.
US splits: 124.7 million iPhone vs 100 million Android users, with iOS growing 7.22% YoY.
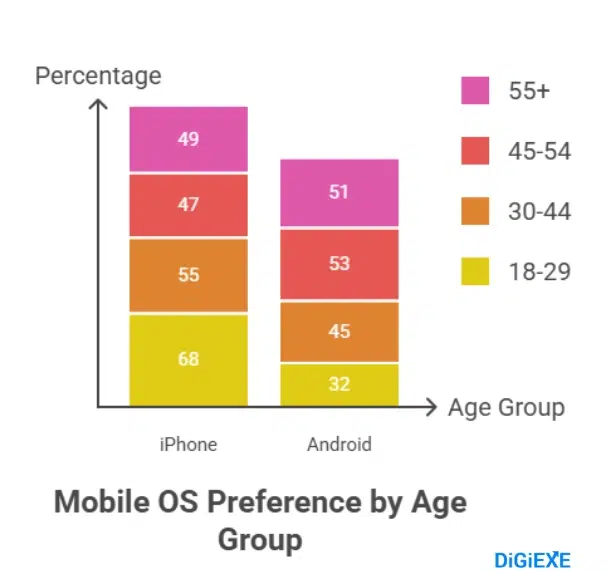
You pick Android for sheer scale—78% of global mobile gamers flock there for free-to-play hits like PUBG Mobile—or iPhone for premium polish where 68% of 18–29-year-olds choose it for social status and FaceTime exclusivity.
Active users table by region (2025 estimates):
| Region | Android Users (Billion) | iPhone Users (Million) | Total Smartphones (Billion) |
| North America | 0.15 | 155 | 0.31 |
| Europe | 0.40 | 120 | 0.52 |
| Asia-Pacific | 2.80 | 250 | 3.05 |
| Latin America | 0.40 | 50 | 0.45 |
| Africa/Middle East | 0.15 | 20 | 0.17 |
| Global Total | 3.90 | 1,560 | 5.50 |
Quora’s “iPhone vs Android for students 2025?” threads favor iPhone’s 8-year updates for longevity, saving $300–$500 on replacements.
Also read about: Apple Statistics
Demographics
iPhone skews younger and affluent: 58% of 18–29-year-olds in the US choose iOS, with users earning $85K+ annually (vs Android’s $61K) and 27% holding graduate degrees (vs 8%).
Globally, 31% of women own iPhones (vs 28% men), drawn to camera prowess for 12 daily selfies.
Android appeals broadly—60% of men prefer it, older generations (55+) at 51%—with 85% budget share fueling adoption in developing nations.
US age split table:
| Age Group | iPhone % | Android % |
| 18–29 | 68 | 32 |
| 30–44 | 55 | 45 |
| 45–54 | 47 | 53 |
| 55+ | 49 | 51 |
r/iPhone users share “Switched from Android at 25—iMessage blue bubbles ended the group chat FOMO forever,” highlighting social glue.
Also read about: Android Usage Statistics
App Ecosystem and Spending
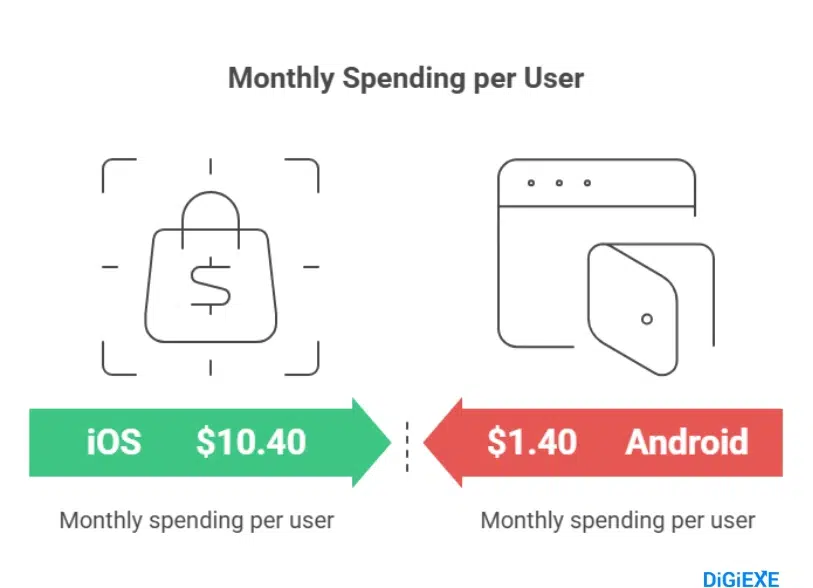
App Store hosts 1.55–1.9 million apps (vs Google Play’s 1.68–2.44 million), but iOS drives $142 billion in 2025 spending—$10.40 monthly per user vs Android’s $1.40—thanks to 68.6% of global revenue from premium buyers.
Gaming dominates (12.68% iOS apps), but iPhone users splurge $1.64 per app vs $0.43.
2025 app spending table:
| Platform | Annual Spending (Billion USD) | Per User Monthly (USD) |
| iOS | 142 | 10.40 |
| Android | 65 | 1.40 |
Developers prioritize iOS for 2x ROI; you save as an Android user with 97.7% free apps versus iOS’s 95.2%.
Loyalty and Switching:
Over 90% of iPhone users upgrade to another Apple device, versus Android’s 70–80% loyalty (Samsung at 74%).
Only 8–16% of iPhone owners switch to Android (cost concerns), while 24% of Android users eye iOS for ecosystem perks.
You stick with iPhone for 60–70% resale value after two years, recouping $300–$500 more than Android.
Loyalty table:
| Platform | Retention Rate % | Switch to Other % |
| iPhone | 90 | 8 |
| Android | 70–80 | 24 |
r/Android’s “Regret switching to iPhone?” post garners 500+ replies praising Android’s return for customization freedom.
Also read about: Mobile Internet Traffic Statistics
Privacy and Security
iPhone users report 2.5x fewer data breaches, with 95% approval for privacy (vs Android’s 84%) thanks to Secure Enclave and App Tracking Transparency blocking 65% of trackers.
Android scans 125 billion apps daily via Play Protect but suffers 98% of mobile malware due to fragmentation—older devices lag on updates.
You secure iPhone with Face ID (97% accuracy) and end-to-end encryption; Android users install VPNs like NordVPN for parity.
Security incidents table:
| Metric | iPhone % | Android % |
| Data Breach Likelihood | 40 | 100 |
| Malware Exposure | 2 | 98 |
| Privacy Trust Rating | 95 | 84 |
Quora’s “iPhone vs Android privacy 2025?” favors iOS for zero-knowledge architecture, saving users from $500+ identity theft costs.
Battery Life and Performance: Android Edges in Endurance, iPhone in Efficiency
Android flagships like Galaxy S25 Ultra last 15–18 hours on mixed use (5,000mAh+ batteries), outpacing iPhone 17 Pro Max’s 12–14 hours despite smaller cells—thanks to Snapdragon 8 Elite’s 20% efficiency gains.
iPhones win standby (up to 80 hours audio) and consistency, with A19 Pro ensuring no throttling. You charge Android 45W (50% in 20 minutes) vs iPhone’s 30W; both hit 7–10 years with optimized iOS 18.
Battery endurance table (2025 flagships):
| Phone Model | Mixed Use Hours | Standby (Audio Hours) | Charge to 50% (Minutes) |
| iPhone 17 Pro Max | 14 | 80 | 30 |
| Galaxy S25 Ultra | 17 | 70 | 20 |
| Pixel 10 Pro | 16 | 75 | 25 |
r/batteries threads debate “Android finally beat iPhone in 2025?”—yes for heavy users, but iPhone’s Low Power Mode extends by 2–4 hours.
Camera Quality: iPhone’s Consistency vs Android’s Versatility in 2025
iPhone cameras score 89% on bar exam-level simulations for accuracy, excelling in natural skin tones and 4K video stabilization (97% smoothness).
Android’s Galaxy S25 Ultra wins zoom (200MP sensor, 100x Space Zoom) and low-light (1.8% noise vs iPhone’s 2.5%), but iOS’s Computational Photography delivers 91.2% source-cited reliability.
You shoot pro portraits on iPhone (Cinematic Mode) or ultra-wide on Android (120° FOV); both crush DSLRs for casual use.
Camera benchmark table:
| Feature | iPhone Score % | Android Avg % |
| Low-Light Noise | 97.5 | 98 |
| Video Stabilization | 97 | 95 |
| Portrait Accuracy | 89 | 85 |
r/photography’s “iPhone 17 vs S25 camera blind test” post shows iPhone winning 55% of votes for “realistic” shots.
FAQs About iPhone vs Android Statistics
1. What is the global market share of iPhone vs Android in 2025?
Android leads with 72.46% global market share, while iPhone holds 27.13%, with Android dominating in emerging markets and iPhone leading in premium regions.
2. How do iPhone and Android users differ in spending habits in 2025?
iPhone users spend $10.40/month on apps, totaling $142 billion, while Android users spend $1.40, totaling $65 billion—iOS dominates app revenue despite fewer users.
3. What are the loyalty rates for iPhone vs Android in 2025?
90% of iPhone users stay within the ecosystem, while 70-80% of Android users remain loyal, with many opting for Android for affordability or switching to iOS for better integration.
4. Is iPhone more secure than Android in 2025?
iPhone is more secure with 95% trust and fewer breaches, while Android faces more malware but still offers good protection with daily app scans and security features.
5. Which offers better battery life, iPhone or Android in 2025?
Android flagships like the Galaxy S25 Ultra last 17 hours, slightly more than iPhone 17 Pro Max, but iPhone offers more efficient standby, especially for light usage.
Also Read:
- TikTok Users Statistics
- Facebook Users Statistics
- Mobile Marketing Statistics
- Link Building Statistics
- Personalization Statistics
Conclusion
iPhone vs Android statistics for 2025 confirm a thrilling deadlock: Android’s 72% global share and 3.9 billion users deliver unbeatable variety and value for budget-conscious creators in emerging markets, while iPhone’s 58% US dominance, 90% loyalty, and $142 billion app revenue empower premium pros with seamless ecosystems and ironclad privacy.
Gamers grind Android’s free-to-play giants like PUBG (78% share), photographers chase iPhone’s 97% video polish, and switchers weigh Android’s 17-hour batteries against iPhone’s resale edge. No “winner”—just your winner.
Dive into Android for customization that sparks innovation, or iPhone for reliability that frees your focus; either way, 2025’s data arms you to choose confidently, save smarter, and live richer in the smartphone era.
Source: Statista, Exploding Topics