

Google Chrome, since its public release in 2008, has transcended its initial offering as a simple web browser for Microsoft Windows to become an indispensable digital tool, rapidly expanding its support to macOS, Linux, and mobile platforms.
By mid-2012, Chrome solidified its position as the world’s most popular browser, a leadership it has maintained with unwavering consistency.
For anyone keen to understand the evolving landscape of the internet and how a dominant browser shapes digital interactions, exploring Google Chrome statistics for 2025 provides crucial insights.
This detailed analysis will delve into Chrome’s expansive user base, its commanding market share across various devices, the wealth of extensions enhancing its functionality, and the innovative features that continue to attract billions of users.
This article will serve as a comprehensive guide for those who seek to harness the full potential of Google Chrome for their benefit.
The Unstoppable Growth of Chrome’s User Base
The sheer number of individuals who rely on Google Chrome for their daily internet activities is staggering.
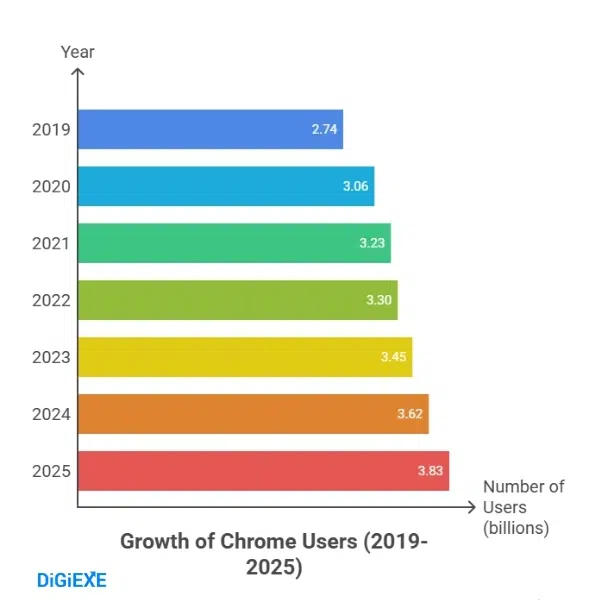
In 2025, an estimated 3.83 billion internet users globally are actively choosing Chrome as their primary browser, marking a substantial increase from 3.06 billion users recorded in 2020.
This impressive growth signifies an addition of approximately 0.77 billion new users over the past five years alone, representing a remarkable 25.16% expansion of the Chrome user base since 2020.
This consistent upward trend underscores Chrome’s ability to continually attract and retain a massive global audience, reflecting its adaptability and user-centric development.
The following table vividly illustrates the consistent growth in the number of Chrome users over the years, demonstrating a sustained upward trajectory that highlights its increasing global adoption.
| Year | Number of Users (in billions) |
| 2014 | 1.25 |
| 2015 | 1.50 |
| 2016 | 1.84 |
| 2017 | 2.04 |
| 2018 | 2.39 |
| 2019 | 2.74 |
| 2020 | 3.06 |
| 2021 | 3.23 |
| 2022 | 3.30 |
| 2023 | 3.45 |
| 2024 | 3.62 |
| 2025 | 3.83 |
These figures are not just numbers; they represent billions of individuals accessing information, connecting with others, and conducting business, all through the gateway of Google Chrome.
The continuous expansion of its user base suggests that Chrome successfully addresses the evolving needs of internet users worldwide, providing a robust and reliable browsing experience.
Also read about: Jungle Scout Chrome Extension
Google Chrome’s Commanding Global Market Share
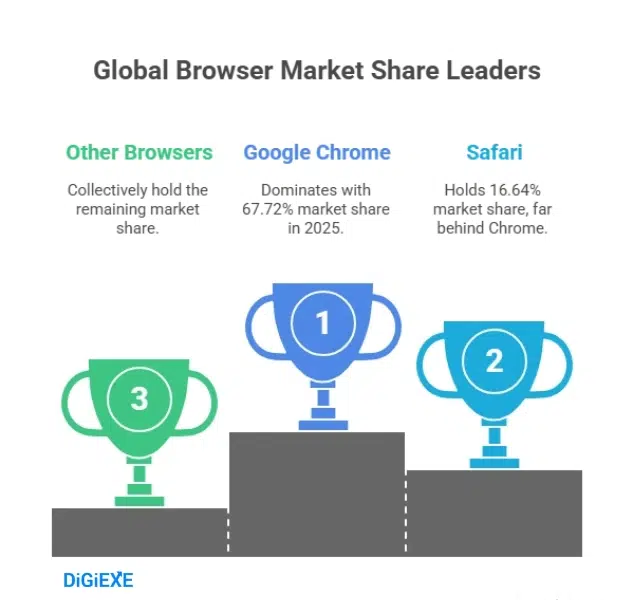
Chrome’s dominance is further cemented by its overwhelming global browser market share, which stands at an impressive 67.72% across all device types in 2025.
This figure represents a slight but significant increase from the 65.82% share registered in 2024, signaling continued growth and consolidation of its market leadership.
To put this into perspective, Safari, the second most popular browser globally, commands a market share of 16.64%, which is more than four times smaller than Chrome’s.
This vast disparity highlights the unparalleled preference users exhibit for Google Chrome.
Let us examine the historical trajectory of Google Chrome’s browser market share, which clearly illustrates its journey to global supremacy.
| Year | Chrome’s Market Share (%) |
| 2009 | 3.23 |
| 2010 | 9.95 |
| 2011 | 19.79 |
| 2012 | 29.30 |
| 2013 | 34.67 |
| 2014 | 38.94 |
| 2015 | 44.87 |
| 2016 | 49.08 |
| 2017 | 53.96 |
| 2018 | 59.12 |
| 2019 | 63.31 |
| 2020 | 64.60 |
| 2021 | 64.45 |
| 2022 | 64.78 |
| 2023 | 63.87 |
| 2024 | 65.82 |
| 2025 | 67.72 |
This table clearly demonstrates Chrome’s consistent upward climb, from a nascent browser to an undisputed market leader, reflecting its continuous innovation and effective adaptation to user demands.
Also read about: Google Ads Statistics
Chrome Across Devices: Mobile, Desktop, and Tablet Dominance
Google Chrome’s pervasive presence extends across all major device categories, albeit with varying degrees of market share.
This adaptability ensures that users experience a consistent and integrated browsing experience regardless of the device they are using.
Mobile Browser Market Share

On mobile devices, Chrome demonstrates an even more pronounced dominance, securing a global market share of 68.34% among mobile users in 2025.
This signifies a noticeable increase from previous years, indicating that Chrome’s presence in the mobile browser market has grown substantially and consistently.
Safari trails behind with 23.02% of the mobile market, reinforcing Chrome’s overwhelming preference among smartphone and tablet users.
This robust performance on mobile platforms is crucial as an increasing number of internet users access the web primarily through their mobile devices.
The evolution of Chrome’s mobile browser market share paints a clear picture of its ascendance in the portable browsing arena.
| Year | Chrome’s Mobile Market Share (%) |
| 2012 | 0.35 |
| 2013 | 3.98 |
| 2014 | 21.25 |
| 2015 | 33.58 |
| 2016 | 38.38 |
| 2017 | 48.86 |
| 2018 | 54.14 |
| 2019 | 60.14 |
| 2020 | 62.50 |
| 2021 | 63.30 |
| 2022 | 64.39 |
| 2023 | 64.12 |
| 2024 | 66.74 |
| 2025 | 68.34 |
This table underscores Chrome’s success in capturing the mobile browsing market, demonstrating its continuous optimization for smaller screens and touch interfaces.
Desktop Browser Market Share
Chrome also firmly holds the leading position in the global desktop browser market, commanding a 64.87% share worldwide.
This consistent dominance highlights its preferred status among users accessing the internet from traditional desktop and laptop computers.
Edge, Chrome’s closest competitor in the desktop segment, trails significantly at 13.78%, further solidifying Chrome’s unassailable lead.
The desktop environment continues to be a critical arena for productivity and detailed web interaction, and Chrome’s strong showing here is a testament to its robust feature set and performance.
Tablet Browser Market Share
While Chrome’s market share on tablets is the lowest among all device types, standing at 48.69% in 2025, it still retains its position as the most popular browser for tablet users.
Safari follows as the second most used browser on tablets, with a market share of 31.19%. This demonstrates that even in a segment where competition is stronger, Chrome manages to maintain a leading edge.
The historical data on Chrome’s market share among tablet users reveals its steady progress in this device category.
| Year | Chrome’s Tablet Market Share (%) |
| 2012 | 3.96 |
| 2013 | 6.87 |
| 2014 | 11.80 |
| 2015 | 16.80 |
| 2016 | 19.41 |
| 2017 | 23.73 |
| 2018 | 23.46 |
| 2019 | 23.82 |
| 2020 | 37.21 |
| 2021 | 44.56 |
| 2022 | 47.99 |
| 2023 | 49.24 |
| 2024 | 48.25 |
| 2025 | 48.69 |
Also read about: Google Searches Statistics
Google Chrome’s Foothold in the United States Market
The United States, a significant tech market, also reflects Chrome’s widespread popularity, though its market share there is slightly lower than its global average.
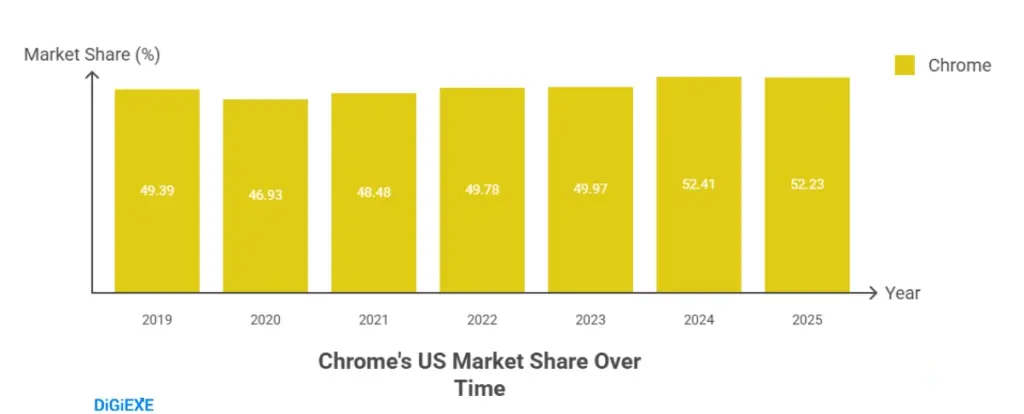
In 2025, Chrome commands a 52.23% share of the US browser market, making it the leading browser in the country.
This consistent performance, holding over 50% of the market share for several years, indicates deep entrenchment in the American digital landscape.
Safari remains the second most used browser in the US, with a 30.6% market share.
Examining the historical data for Chrome’s market share in the US since 2009 provides context for its current position.
| Year | Chrome’s US Market Share (%) |
| 2009 | 2.99 |
| 2010 | 8.58 |
| 2011 | 14.92 |
| 2012 | 20.81 |
| 2013 | 26.65 |
| 2014 | 31.36 |
| 2015 | 38.38 |
| 2016 | 43.40 |
| 2017 | 45.27 |
| 2018 | 49.40 |
| 2019 | 49.39 |
| 2020 | 46.93 |
| 2021 | 48.48 |
| 2022 | 49.78 |
| 2023 | 49.97 |
| 2024 | 52.41 |
| 2025 | 52.23 |
Within the US, Chrome also dominates the desktop search market, holding a substantial 62.08% share.
This is a significant lead over its closest competitor, Edge, which has a market share more than four times smaller at 13.78%.
Safari ranks third among desktop users in the US with 12.21%. This strong performance on desktops highlights Chrome’s appeal to users who require a powerful and efficient browser for work and extensive web browsing.
Here is a detailed look at Chrome’s desktop browser market share in the US since 2009.
| Year | Chrome’s US Desktop Market Share (%) |
| 2009 | 3.03 |
| 2010 | 8.95 |
| 2011 | 16.09 |
| 2012 | 23.54 |
| 2013 | 32.08 |
| 2014 | 36.87 |
| 2015 | 42.10 |
| 2016 | 51.40 |
| 2017 | 55.66 |
| 2018 | 61.99 |
| 2019 | 63.17 |
| 2020 | 58.84 |
| 2021 | 59.46 |
| 2022 | 59.89 |
| 2023 | 56.64 |
| 2024 | 60.99 |
| 2025 | 62.08 |
For mobile browsing in the US, Chrome holds a usage share of 42.49%, positioning it as the second most popular mobile browser in the country.
Safari leads the mobile segment with a market share of 50.18%, indicating a preference for Apple’s native browser among its device users.
Despite this, Chrome’s strong presence on mobile in the US underscores its widespread adoption across different ecosystems.
The progression of Chrome’s mobile browser market share in the US since 2012 provides valuable context.
| Year | Chrome’s US Mobile Market Share (%) |
| 2012 | 0.44 |
| 2013 | 5.48 |
| 2014 | 24.22 |
| 2015 | 38.70 |
| 2016 | 36.56 |
| 2017 | 39.13 |
| 2018 | 40.56 |
| 2019 | 40.09 |
| 2020 | 37.24 |
| 2021 | 38.64 |
| 2022 | 41.43 |
| 2023 | 40.68 |
| 2024 | 45.04 |
| 2025 | 42.49 |
These statistics reveal Chrome’s robust and consistent performance in the competitive US market, demonstrating its ability to attract a large and loyal user base across various devices.
The Power of Customization: Chrome Extensions
A significant factor contributing to Chrome’s enduring popularity is its extensive ecosystem of extensions.
These small software programs enhance the browser’s functionality, allowing users to tailor their browsing experience to their specific needs and preferences.
As of August 2024, there are 111,933 Chrome extensions available, though this number has seen a slight decrease from 137,345 in May 2020.
This indicates a potential shift towards quality and utility over sheer quantity, with developers focusing on creating more impactful and useful tools.
More than half of these extensions, specifically 55.5%, fall under the productivity category, while 33.3% are categorized as lifestyle. This distribution highlights a strong user demand for tools that streamline work, manage tasks, and enhance daily online activities.
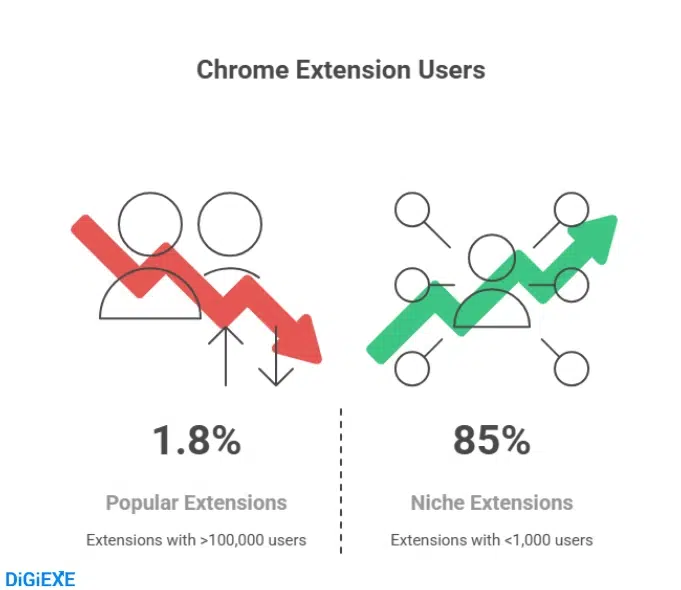
Interestingly, the vast majority of Chrome extensions, 95,136 or 85% of the total, have fewer than 1,000 users. Conversely, only 2,000 extensions, representing 1.8%, boast more than 100,000 users.
This reveals a landscape where a small number of highly popular extensions serve a massive user base, while a multitude of niche extensions cater to specialized needs.
The following table provides a comprehensive breakdown of Chrome extensions by the number of users as of August 2024, offering insights into their adoption rates.
| Number of Users | Number of Chrome Extensions | Percentage of Total |
| Less than 100 | 64,526 | 57.65% |
| Between 100 and 1,000 | 30,610 | 27.35% |
| Between 1,000 and 10,000 | 8,929 | 7.98% |
| Between 10,000 and 100,000 | 5,868 | 5.24% |
| Between 100,000 and 1 million | 1,758 | 1.57% |
| More than 1 million | 242 | 0.22% |
Among this vast collection, Google itself develops 16 Chrome extensions, as of September 2025.
A testament to their utility, 8 of these Google-developed extensions have garnered more than 1 million users, demonstrating Google’s commitment to enhancing the Chrome experience with its own robust tools.
The Reach of the Chrome App: Downloads and Ratings
The mobile incarnation of Google Chrome further solidifies its position as a dominant force in the digital world.
As of September 2025, the Google Chrome mobile app has been downloaded an astounding 83.89 million times across both iOS and Android platforms.
This remarkable figure underscores the app’s widespread appeal and its essential role in mobile internet access.
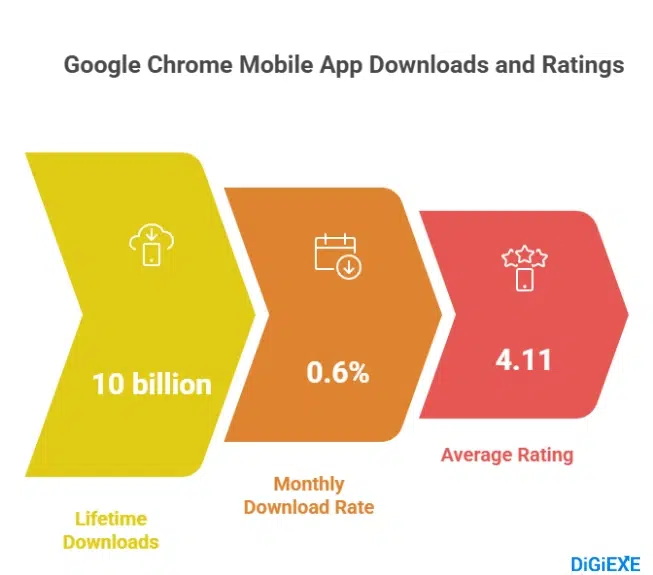
On the Google Play Store, the Chrome mobile app has surpassed the monumental milestone of 10 billion lifetime downloads, a feat achieved in December 2021.
This makes it the second most downloaded free Android app worldwide, trailing only YouTube.
The Chrome app’s consistent download rate of 0.6% monthly and 1.2% every two months on Google Play further signifies its continuous adoption by new users.
Beyond downloads, user satisfaction is reflected in ratings. The Google Chrome app holds an average rating of 4.11 from over 42.48 million users on the Google Play App.
While this is a respectable rating, WhatsApp currently leads the list by the number of ratings, with more than 176.07 million ratings and an average of 4.28.
These high download and rating figures underscore the positive user experience associated with the Chrome mobile app.
FAQs About Google Chrome Statistics
1. How many people are currently using Google Chrome worldwide in 2025?
In 2025, an estimated 3.83 billion internet users around the globe are actively utilizing Google Chrome as their web browser, reflecting a significant increase in its user base over the past five years.
2. What is Google Chrome's global market share across all devices in 2025?
Google Chrome maintains an impressive global browser market share of 67.72% across all device types in 2025, solidifying its position as the leading browser by a significant margin.
3. How many extensions are available for Google Chrome, and what types are most popular?
As of August 2024, there are 111,933 Chrome extensions available on the Chrome Web Store, with productivity-focused extensions being the most popular, accounting for over half of the total.
4. Is Google Chrome still the most popular browser on mobile devices in 2025?
Yes, Google Chrome continues to dominate the mobile browser market in 2025 with a commanding 68.34% share globally, demonstrating its widespread preference among smartphone and tablet users.
5. What new features or improvements can users expect from Google Chrome in relation to common concerns like privacy and performance?
Users can expect continued enhancements in privacy, including ongoing developments with the Privacy Sandbox initiative for more private advertising, and significant improvements in performance through features like Memory Saver and Energy Saver modes that optimize resource consumption and battery life.
Also Read:
- Gmail Statistics
- TikTok Users Statistics
- Snapchat User Statistics
- Android Usage Statistics
- Mobile Marketing Statistics
Conclusion
Google Chrome’s trajectory in 2025 firmly establishes its position as the undisputed leader in the global browser market.
With over 3.83 billion users, a commanding 67.72% overall market share, and robust performance across mobile, desktop, and tablet devices, Chrome has solidified its dominance through continuous innovation and a deep understanding of user needs.
The extensive ecosystem of over 111,933 extensions further empowers users to customize their browsing experience, while ongoing efforts to enhance privacy and optimize performance directly address key user concerns articulated in online communities.
Chrome’s consistent growth, coupled with its adaptability to evolving technological landscapes and user expectations, suggests that its reign is far from over.
As the internet continues to grow and diversify, Google Chrome stands poised to remain at the forefront, shaping how billions of people interact with the digital world.
The journey of Chrome is a testament to sustained development, strategic enhancements, and a commitment to providing a superior browsing experience for users across the globe.
Source: StatCounter, Statista