

TikTok transforms the social media landscape in 2025, captivating 1.12 billion to 1.59 billion monthly active users worldwide as content creators, marketers, influencers, and businesses leverage tiktok users statistics 2025 to craft addictive videos, target demographics, and drive unprecedented engagement.
The platform surges with 875 million to 954 million daily active users, where young adults aged 18-24 dominate creators at over 52 percent, spending 52 to 98 minutes daily discovering trends, music, and products.
The United States hosts 135.79 million to 170 million users, generating $10 billion in revenue, while Indonesia claims 107.7 million and global downloads hit 436.82 million in the first half alone.
Revenue explodes to $20 billion to $23 billion, up 42.86 percent, fueled by ads and in-app purchases.
Readers seeking to understand TikTok users and harness them for benefits—like growing follower counts through challenges, monetizing via TikTok Shop, or advertising to Gen Z’s 27.2 percent share—uncover here a wealth of demographics, regional insights, usage patterns, and fresh Quora-Reddit discussions.
From Asia-Pacific’s 296.8 million users to the app’s 55.7 percent male skew, these statistics empower you to optimize algorithms, collaborate with influencers, and turn views into revenue amid bans and AI integrations.
The User Explosion
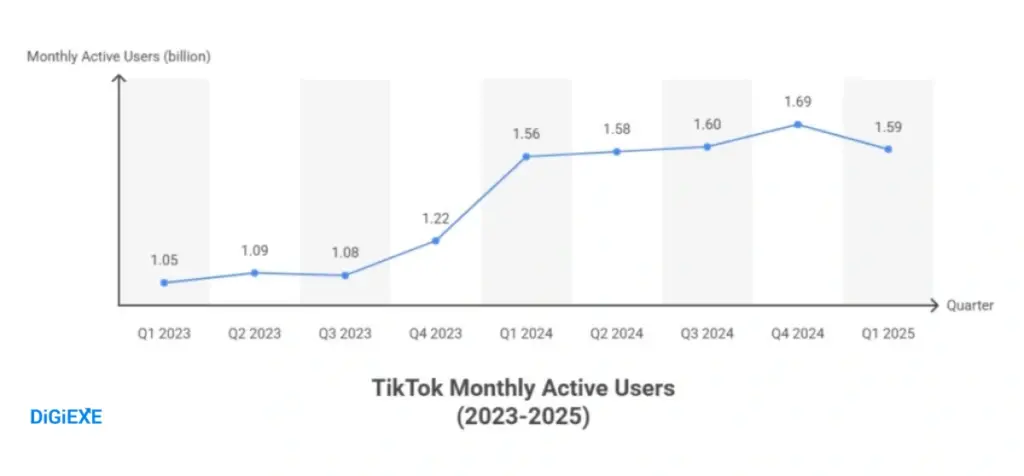
TikTok achieves 1.59 billion monthly active users by early 2025, a slight dip from Q4 2024’s 1.69 billion yet reflecting robust growth from 1.56 billion in Q1 2024.
Bytedance celebrates surpassing 1 billion in 2021, now capturing 35.27 percent of 5.5 billion internet users and 35.86 percent of 5.41 billion social media participants.
Creators upload daily dances and tutorials, attracting 2.5 million new signups daily in peak periods.
This MAU progression table illustrates the climb:
| Quarter/Year | Monthly Active Users (Billions) | Growth from Prior |
| Q1 2025 | 1.59 | -5.92% |
| Q4 2024 | 1.69 | +5.62% |
| Q3 2024 | 1.60 | +1.27% |
| Q2 2024 | 1.58 | +1.28% |
| Q1 2024 | 1.56 | +27.87% |
| Q4 2023 | 1.22 | +12.96% |
| Q3 2023 | 1.08 | -0.91% |
| Q2 2023 | 1.09 | +3.81% |
| Q1 2023 | 1.05 | +5% |
Marketers launch timed challenges during surges to boost visibility.
Daily actives range 875 million to 954 million, 55-60 percent of MAUs, highlighting stickiness. Teens average 1.5 hours daily in the U.S., underscoring addiction potential for brands.
Also read about: Facebook Users Statistics
Regional Hotspots: U.S. Leads with 170 Million, Asia Surges
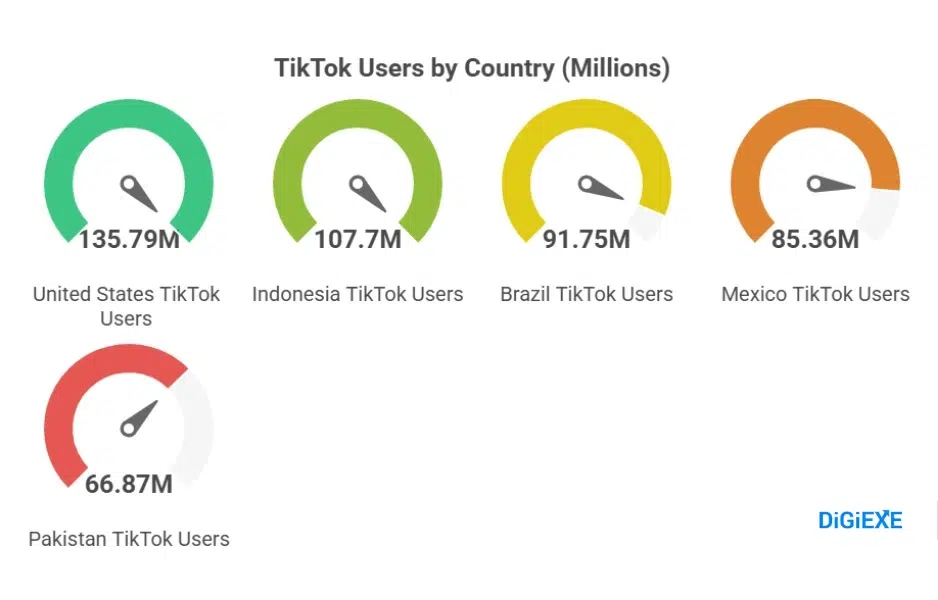
The United States claims the largest audience at 135.79 million to 170 million users, where 33 percent of adults and 59 percent aged 18-29 engage.
Indonesia follows with 107.7 million, Brazil 91.75 million, Mexico 85.36 million, Pakistan 66.87 million.
Asia-Pacific/Middle East/Africa combine for 51.17 percent, 530.7 million users. Latin America: 189.7 million, North America: 122.4 million, Western Europe: 102.6 million, Central/Eastern Europe: 91.7 million.
This country table spotlights targeting:
| Country | Users (Millions) | Key Demo | Benefit Strategy |
| U.S. | 135.79-170 | 18-29: 59% | Shop integrations, live sales |
| Indonesia | 107.7 | Young adults | Bahasa trends, local influencers |
| Brazil | 91.75 | Diverse ages | Portuguese challenges |
| Mexico | 85.36 | Gen Z heavy | Spanish music collabs |
| Pakistan | 66.87 | 18-34 dominant | Urdu education content |
| Philippines | 62.35 | High engagement | Pinoy dances, giveaways |
| Russia | 55.98 | Adult users | Russian news filters |
| Bangladesh | 46.51 | Emerging market | Bengali tutorials |
| Egypt | 41.3 | Youth | Arabic comedy skits |
| Vietnam | 40.87 | Rapid growth | Vietnamese beauty hacks |
Brands localize in Indonesia for viral potential amid 107.7 million users.
Also read about: YouTube Statistics
Demographic Deep Dive: Gen Z and Females Fuel Virality
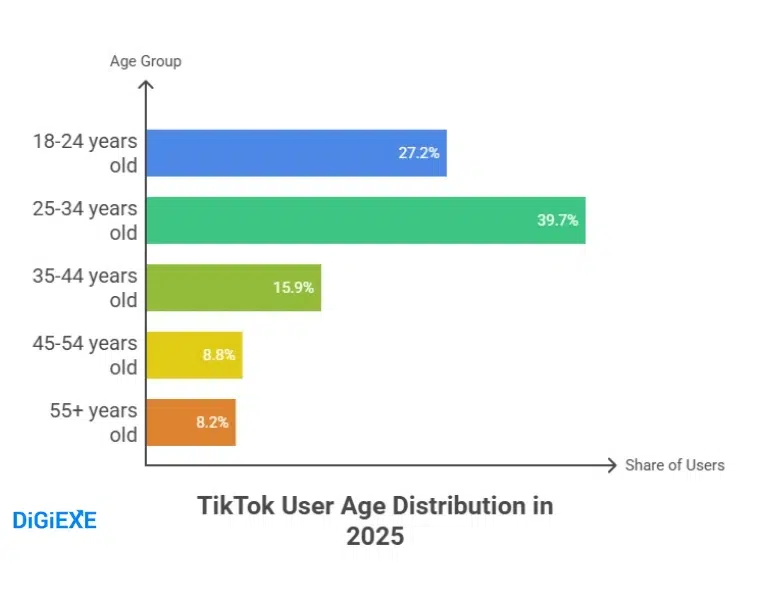
Users aged 25-34 lead at 23.3 percent to 39.7 percent, 18-24 at 25 percent to 30.2 percent, totaling over 50 percent under 35. Females hold 51.6 percent to 55 percent globally, 61.4 percent in U.S.
This age table informs creation:
| Age Group | Global Share (%) | U.S. Share (%) | Content Tip |
| 13-17 | 21 (est.) | – | School hacks, trends |
| 18-24 | 25-30.2 | 25 | Challenges, music |
| 25-34 | 23.3-39.7 | 30 | Career, beauty |
| 35-44 | 12.6-15.9 | 19 | Parenting, recipes |
| 45-54 | 7.5-8.8 | 13 | Health, finance |
| 55+ | 5.5-8.2 | 14 | Nostalgia, easy tutorials |
Influencers target 18-24 for 52.83 percent creator share.
Gender: Females 44.3 percent to 55 percent global, 61.4 percent U.S.
This gender table:
| Gender | Global Share (%) | U.S. Share (%) |
| Male | 45-48.4 | 38.6 |
| Female | 51.6-55 | 61.4 |
Beauty brands favor female skew for ads.
Also read about: Instagram Statistics
Download Dominance: 5 Billion+ and Counting
Cumulative downloads exceed 5 billion. 2024: 773 million to 875.67 million, 2023: 963.64 million, 2022: 856.69 million.
Q1/Q2 2025: 436.82 million. Peak Q1 2020: 313.5 million.
Android dominates 90 percent, except U.S. iOS preference.
This quarterly downloads table:
| Quarter | Downloads (Millions) | Growth |
| Q1 2025 | 244.51 | +27.14% |
| Q2 2025 | 192.31 | -21.35% |
| Q4 2024 | 186.26 | -10.17% |
| Q3 2024 | 207.02 | -16.93% |
| Q2 2024 | 249.45 | +7.12% |
| Q1 2024 | 232.94 | +7.01% |
Developers release region-specific apps for peaks.
Also read about: X (Twitter) Statistics
Revenue Rockets: $23 Billion and Ad Dominance
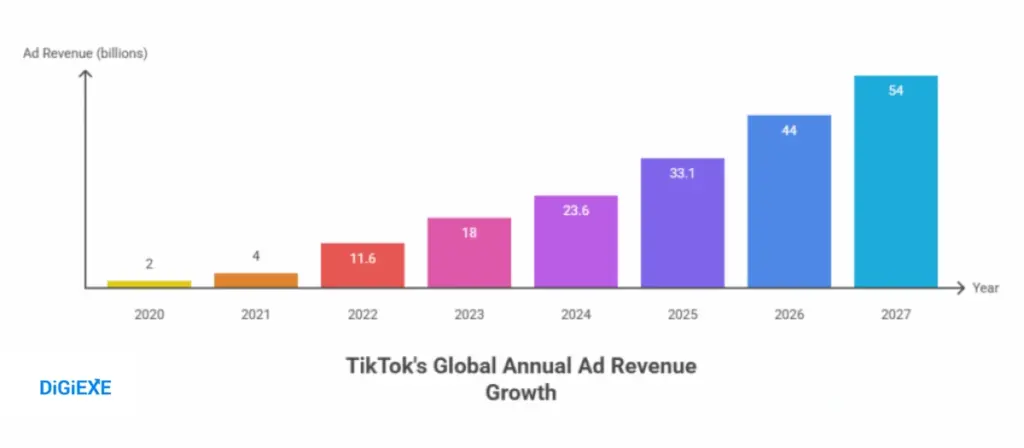
2024 revenue: $23 billion, up 42.86 percent from $16.1 billion 2023. In-app: $1.123 billion Q4 2024, 77 percent ads.
U.S.: $10 billion 2024. Projections: $33.1 billion 2025, $54 billion 2027.
This revenue table:
| Year | Revenue (Billions USD) | YoY Growth (%) |
| 2027 | 54 | +22.7 |
| 2026 | 44 | +32.7 |
| 2025 | 33.1 | +40.5 |
| 2024 | 23.6 | +42.86 |
| 2023 | 18 | +67.71 |
| 2022 | 11.6 | +100 |
| 2021 | 4 | +84.62 |
| 2020 | 2 | +642.86 |
Monetize via Shop for emerging e-commerce.
Engagement Essentials: 95 Minutes Daily and Music Discovery
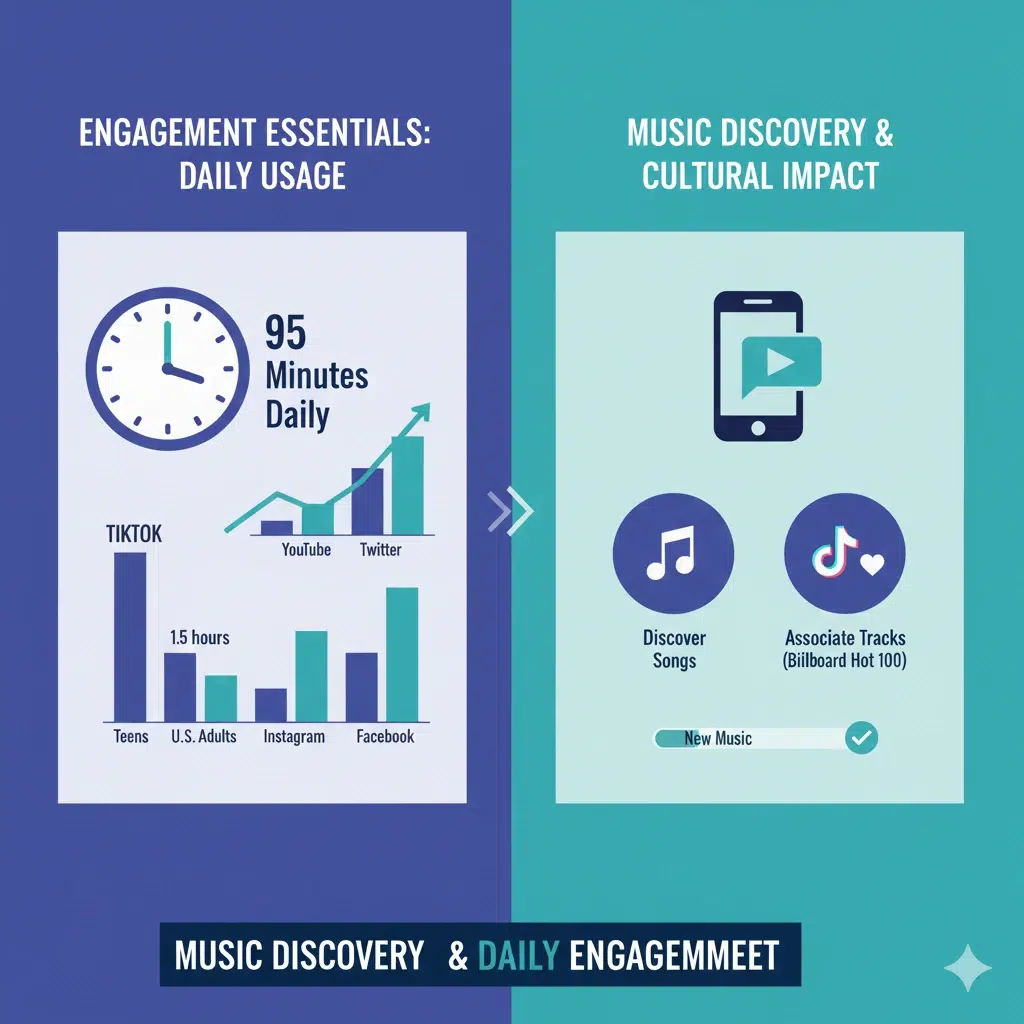
Global: 95 to 98 minutes daily, U.S. adults 52 minutes, teens 1.5 hours. 75 percent discover songs, 73 percent associate tracks with TikTok, charting 175 Billboard Hot 100.
U.S. vs. platforms:
| Platform | Daily Minutes |
| TikTok | 53.8 |
| YouTube | 48.7 |
| 34.1 | |
| 33.1 | |
| 30.1 |
Music labels promote via sounds for streams.
Creator Demographics: 18-24 Lead at 52.83 Percent
18-24: 52.83 percent creators, under 18: 27.47 percent, 35-44: 2.75 percent.
This creator age table:
| Age Group | Creator Share (%) |
| Under 18 | 27.47 |
| 18-24 | 52.83 |
| 25-34 | (est. high) |
| 35-44 | 2.75 |
| 45-54 | 1.65 |
| 55+ | 0.36 |
Young creators favor dances; older, education.
Top Accounts: Khabane Lame’s 161.5 Million
Khabane Lame: 161.5 million, Charli D’Amelio: 156.4 million, MrBeast: 119.4 million.
This top accounts table:
| Account | Followers (Millions) |
| Khabane Lame | 161.5 |
| Charli D’Amelio | 156.4 |
| MrBeast | 119.4 |
| Bella Poarch | 93.4 |
| Addison Rae | 88.4 |
Collaborate for cross-promos.
Quora and Reddit Revelations: Latest User Buzz
Quora users ask “Will TikTok surpass YouTube in users 2025?”—experts predict close with 1.59 billion vs. 2.5 billion, but TikTok’s 95 minutes daily edges YouTube’s 48.7. Reddit’s r/tiktok debates U.S. ban’s impact on 170 million, sharing workaround VPNs.
r/marketing discusses Gen Z’s 25 percent U.S. share for brands, recommending AR filters. Quora queries “Best TikTok growth hacks 2025?”—duets, sounds, Shop integrations.
r/technology highlights music discovery, 75 percent find songs; users share playlists.
Incorporate AR for engagement.
Strategic Benefits: From Creators to Brands
Creators monetize Shop amid $23 billion revenue. Marketers target U.S. 170 million with ads. Businesses launch challenges for virality.
Educators use for 1.5-hour teen sessions. Privacy seekers note data policies.
Developers build sounds for 73 percent associations.
FAQs About TikTok User Statistics
1. How many TikTok users exist in 2025 and what drives the platform's appeal?
TikTok boasts 1.12 billion to 1.59 billion monthly active users in 2025, driven by short-form videos, music discovery for 75 percent, and trends that keep 18-24 creators at 52.83 percent engaged 95 minutes daily.
2. Which countries lead in TikTok users and how can marketers benefit?
The U.S. leads with 135.79 million to 170 million users, Indonesia 107.7 million; marketers benefit by localizing challenges and ads to tap Gen Z’s 25 percent, generating $10 billion U.S. revenue.
3. What demographics define TikTok users in 2025 and why matter for content?
Users aged 25-34 comprise 23.3 percent to 39.7 percent, females 51.6 percent to 55 percent; they matter as videos yield 0.30 percent engagement, guiding creators to music-integrated content for virality.
4. How has TikTok's revenue grown in 2025 and what’s next for monetization?
TikTok earns $20 billion to $23 billion in 2024, projecting $33.1 billion in 2025; next, Shop expansions and in-app purchases enable creators to monetize 175 Billboard-charting songs.
5. Why do users spend time on TikTok in 2025 and how can businesses engage?
Users average 95 minutes daily for entertainment and discovery; businesses engage via AR filters and challenges, targeting U.S. 52-minute adults for ads amid 436.82 million H1 downloads.
Also Read:
- iPhone Users Statistics
- DeepSeek AI Statistics
- Link Building Statistics
- ChatGPT Statistics
- SEO Statistics
Conclusion
In conclusion, TikTok’s 1.59 billion users in 2025 are not just reshaping culture—they’re driving commerce, creativity, and innovation.
With its powerful algorithm, global reach, and a revenue projection of $33.1 billion, TikTok offers immense opportunities for creators, marketers, and businesses.
From viral trends to targeted ads and seamless in-app purchases, TikTok empowers users worldwide to turn engagement into profit.
Whether you’re a creator, brand, or small business, TikTok is a platform where participation leads to lasting impact and success.
Source: Statista, Business of Apps